|
Coatbridge & Chryston
Labour hold

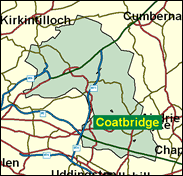
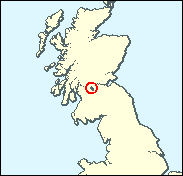
Formerly Monklands West, Coatbridge and Chryston is yet another Scottish Labour seat. These will be fewer in number soon, as the allocation of MPs is reduced to the UK average following the grant of a Scottish Parliament with tax raising powers, and this seat is now very clearly over-represented with its electorate of only 52,000 in 1997, when the national norm was very nearly 70,000. Coatbridge looks very similar to many other working class industrial seats in central Scotland, with a council housing and working class majority - neither so common now as even 20 years ago - and unlike its neighbouring if not twin town of Airdrie it has long been runoured to have a very high proportion of Roman Catholics, many of Irish origin. It is also the proud home of Albion Football Club, stalwarts of the Scottish Third Division.

Tom Clarke, an MP in this neighbourhood since 1973, was dropped from the government by Tony Blair after only one year as Film and Tourism minister, his appointment in 1997 having been required under Labour’s rule about appointing to government anyone with an elected place on the Shadow Cabinet. As a minister he published a report on the British film industry. Born 1941, educated at St Mary’s (RC) Secondary School, Coatbridge, he previously worked for the Scottish Film Council. He resented charges that he had been disloyal to Labour in the tricky Monklands East byelection in 1994 where traditional religious rivalries were mobilised.
 |
| Wealthy Achievers, Suburban Areas |
4.34% |
14.99% |
28.91 |
|
| Affluent Greys, Rural Communities |
0.00% |
2.13% |
0.00 |
|
| Prosperous Pensioners, Retirement Areas |
0.18% |
2.49% |
7.13 |
|
| Affluent Executives, Family Areas |
1.90% |
4.43% |
42.86 |
|
| Well-Off Workers, Family Areas |
12.09% |
7.27% |
166.22 |
|
| Affluent Urbanites, Town & City Areas |
3.84% |
2.56% |
149.78 |
|
| Prosperous Professionals, Metropolitan Areas |
0.00% |
2.04% |
0.00 |
|
| Better-Off Executives, Inner City Areas |
0.21% |
3.94% |
5.27 |
|
| Comfortable Middle Agers, Mature Home Owning Areas |
2.72% |
13.04% |
20.87 |
|
| Skilled Workers, Home Owning Areas |
3.69% |
12.70% |
29.02 |
|
| New Home Owners, Mature Communities |
3.78% |
8.14% |
46.46 |
|
| White Collar Workers, Better-Off Multi Ethnic Areas |
0.80% |
4.02% |
19.90 |
|
| Older People, Less Prosperous Areas |
5.10% |
3.19% |
160.25 |
|
| Council Estate Residents, Better-Off Homes |
37.79% |
11.31% |
334.10 |
|
| Council Estate Residents, High Unemployment |
11.93% |
3.06% |
389.66 |
|
| Council Estate Residents, Greatest Hardship |
11.63% |
2.52% |
461.95 |
|
| People in Multi-Ethnic, Low-Income Areas |
0.00% |
2.10% |
0.00 |
|
| Unclassified |
0.00% |
0.06% |
0.00 |
|
|
 |
 |
 |
| £0-5K |
11.13% |
9.41% |
118.28 |
|
| £5-10K |
19.51% |
16.63% |
117.32 |
|
| £10-15K |
18.42% |
16.58% |
111.12 |
|
| £15-20K |
14.17% |
13.58% |
104.30 |
|
| £20-25K |
10.19% |
10.39% |
98.05 |
|
| £25-30K |
7.20% |
7.77% |
92.56 |
|
| £30-35K |
5.08% |
5.79% |
87.76 |
|
| £35-40K |
3.62% |
4.33% |
83.48 |
|
| £40-45K |
2.60% |
3.27% |
79.64 |
|
| £45-50K |
1.89% |
2.48% |
76.13 |
|
| £50-55K |
1.39% |
1.90% |
72.90 |
|
| £55-60K |
1.03% |
1.47% |
69.91 |
|
| £60-65K |
0.77% |
1.15% |
67.14 |
|
| £65-70K |
0.59% |
0.91% |
64.55 |
|
| £70-75K |
0.45% |
0.72% |
62.13 |
|
| £75-80K |
0.34% |
0.57% |
59.86 |
|
| £80-85K |
0.27% |
0.46% |
57.73 |
|
| £85-90K |
0.21% |
0.37% |
55.72 |
|
| £90-95K |
0.16% |
0.31% |
53.84 |
|
| £95-100K |
0.13% |
0.25% |
52.06 |
|
| £100K + |
0.57% |
1.34% |
42.74 |
|
|
|

|


|
1992-1997
|
1997-2001
|
|
|
|
| Con |
-6.95% |
| Lab |
6.52% |
| LD |
-0.45% |
| SNP |
0.22% |
|
| Con |
-0.14% |
| Lab |
8.40% |
| LD |
3.44% |
| SNP |
-17.02% |
|
|
 |
Tom Clarke
Labour hold
|
| Con |
 |
2,171 |
8.41% |
| Lab |
 |
19,807 |
76.72% |
| LD |
 |
2,293 |
8.88% |
| Oth |
 |
1,547 |
5.99% |
| Maj |
 |
17,514 |
67.84% |
| Turn |
 |
25,818 |
49.48% |
|
|
 |
Tom Clarke
Labour hold
|
| L |
Tom Clarke |
19,807 |
76.72% |
|
Peter Kearney |
0 |
0.00% |
| C |
Patrick Ross-Taylor |
2,171 |
8.41% |
| SSP |
Lynne Sheridan |
1,547 |
5.99% |
| LD |
Alistair Tough |
2,293 |
8.88% |
|
Candidates representing 5 parties stood for election to this seat.
|
|
 |
Tom Clarke
Labour
|
| Con |
 |
3,216 |
8.55% |
| Lab |
 |
25,697 |
68.32% |
| LD |
 |
2,048 |
5.45% |
| SNP |
 |
6,402 |
17.02% |
| Ref |
 |
249 |
0.66% |
| Oth |
|
0 |
0.00% |
| Maj |
 |
19,295 |
51.30% |
| Turn |
 |
37,612 |
72.30% |
|
|
 |
|
Labour
|
| Con |
 |
6,241 |
15.50% |
| Lab |
 |
24,843 |
61.80% |
| LD |
 |
2,388 |
5.90% |
| SNP |
 |
6,743 |
16.80% |
| Oth |
|
0 |
0.00% |
| Maj |
 |
18,100 |
45.00% |
| Turn |
 |
40,215 |
76.12% |
|
|
 |
|

|

