|
Colchester
Liberal Democrat hold

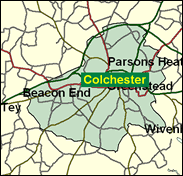
Predictions in the very tight three-way marginal of Colchester are almost impossible to make. The latest evidence is from the May 2000 local elections in the Borough of Colchester, in which the Liberal Democrats carried six wards, the Conservatives four and Labour three; but the Lib Dems do better in municipal contests than in parliamentary battles in most places, so that is inconclusive. Two factors in the favour of their sitting MP Bob Russell may be his personal vote now he is an active incumbent, and the possibility of a tactical squeeze on Labour, although the latter seems unlikely when Labour were themselves less than 2,000 votes short of victory in the 1997 General Election. Best to keep an open eye and an open mind on this one.

Bob Russell, Liberal-Democrat victor here in 1997, big-spectacled and with a white front-combed pudding basin haircut, looks like a cross between a scout master and the Milky Bar Kid 40 years on. Born 1946, Colchester exudes from every pore. Schooled here at St Helena’s Secondary Modern, and at North East Essex Technical College, he was in turn a local Labour, SDP and - still is - a Lib Dem councillor, and worked before 1997 as press officer at the local Essex University. He will also tell you that Humpty Dumpty was a Royalist gun on Colchester Town wall, knocked out during the Civil War. He likes Morris dancing, but not homosexual sex at 16, and wants darts made an Olympic sport. His Tory opponent is Kevin Bentley, a reporter on BBC TV East Born 1946, educated at Alderman Leach School, Gorleston, Norfolk, he left school at 16 to work as an accounts clerk at the BBC, later took a BBC journalism course, and is currently a partner in Writtle Communications, a PR and media training company.
 |
| Wealthy Achievers, Suburban Areas |
14.58% |
14.99% |
97.25 |
|
| Affluent Greys, Rural Communities |
0.00% |
2.13% |
0.00 |
|
| Prosperous Pensioners, Retirement Areas |
1.23% |
2.49% |
49.44 |
|
| Affluent Executives, Family Areas |
12.11% |
4.43% |
273.63 |
|
| Well-Off Workers, Family Areas |
9.28% |
7.27% |
127.57 |
|
| Affluent Urbanites, Town & City Areas |
5.95% |
2.56% |
232.10 |
|
| Prosperous Professionals, Metropolitan Areas |
0.12% |
2.04% |
5.67 |
|
| Better-Off Executives, Inner City Areas |
3.34% |
3.94% |
84.79 |
|
| Comfortable Middle Agers, Mature Home Owning Areas |
16.14% |
13.04% |
123.76 |
|
| Skilled Workers, Home Owning Areas |
8.18% |
12.70% |
64.41 |
|
| New Home Owners, Mature Communities |
9.04% |
8.14% |
111.06 |
|
| White Collar Workers, Better-Off Multi Ethnic Areas |
6.02% |
4.02% |
149.70 |
|
| Older People, Less Prosperous Areas |
2.08% |
3.19% |
65.30 |
|
| Council Estate Residents, Better-Off Homes |
9.28% |
11.31% |
82.09 |
|
| Council Estate Residents, High Unemployment |
1.11% |
3.06% |
36.14 |
|
| Council Estate Residents, Greatest Hardship |
1.29% |
2.52% |
51.10 |
|
| People in Multi-Ethnic, Low-Income Areas |
0.00% |
2.10% |
0.00 |
|
| Unclassified |
0.25% |
0.06% |
395.53 |
|
|
 |
 |
 |
| £0-5K |
9.20% |
9.41% |
97.69 |
|
| £5-10K |
16.87% |
16.63% |
101.43 |
|
| £10-15K |
17.16% |
16.58% |
103.50 |
|
| £15-20K |
14.12% |
13.58% |
103.98 |
|
| £20-25K |
10.73% |
10.39% |
103.21 |
|
| £25-30K |
7.90% |
7.77% |
101.63 |
|
| £30-35K |
5.77% |
5.79% |
99.60 |
|
| £35-40K |
4.22% |
4.33% |
97.39 |
|
| £40-45K |
3.11% |
3.27% |
95.15 |
|
| £45-50K |
2.31% |
2.48% |
92.98 |
|
| £50-55K |
1.73% |
1.90% |
90.93 |
|
| £55-60K |
1.31% |
1.47% |
89.02 |
|
| £60-65K |
1.00% |
1.15% |
87.25 |
|
| £65-70K |
0.78% |
0.91% |
85.63 |
|
| £70-75K |
0.61% |
0.72% |
84.14 |
|
| £75-80K |
0.48% |
0.57% |
82.78 |
|
| £80-85K |
0.38% |
0.46% |
81.53 |
|
| £85-90K |
0.30% |
0.37% |
80.38 |
|
| £90-95K |
0.24% |
0.31% |
79.32 |
|
| £95-100K |
0.20% |
0.25% |
78.34 |
|
| £100K + |
0.99% |
1.34% |
73.46 |
|
|
|

|


|
1992-1997
|
1997-2001
|
|
|
|
| Con |
-10.65% |
| Lab |
6.46% |
| LD |
1.69% |
|
| Con |
-6.37% |
| Lab |
-0.66% |
| LD |
8.20% |
|
|
 |
Bob Russell
Liberal Democrat hold
|
| Con |
 |
10,925 |
24.98% |
| Lab |
 |
13,074 |
29.89% |
| LD |
 |
18,627 |
42.59% |
| Oth |
 |
1,110 |
2.54% |
| Maj |
 |
5,553 |
12.70% |
| Turn |
 |
43,736 |
55.39% |
|
|
 |
Bob Russell
Liberal Democrat hold
|
| L |
Kevin Bentley |
13,074 |
29.89% |
| C |
Chris Fegan |
10,925 |
24.98% |
| UK |
Roger Lord |
631 |
1.44% |
| Grey |
Leonard Overy-Owen |
479 |
1.10% |
| LD |
Bob Russell |
18,627 |
42.59% |
|
Candidates representing 5 parties stood for election to this seat.
|
|
 |
Bob Russell
Liberal Democrat gain
|
| Con |
 |
16,305 |
31.35% |
| Lab |
 |
15,891 |
30.56% |
| LD |
 |
17,886 |
34.39% |
| Ref |
 |
1,776 |
3.41% |
| Oth |
 |
148 |
0.28% |
| Maj |
 |
1,581 |
3.04% |
| Turn |
 |
52,006 |
69.58% |
|
|
 |
|
Conservative
|
| Con |
 |
23,692 |
42.00% |
| Lab |
 |
13,582 |
24.10% |
| LD |
 |
18,424 |
32.70% |
| Oth |
 |
658 |
1.20% |
| Maj |
 |
5,268 |
9.30% |
| Turn |
 |
56,356 |
76.83% |
|
|
 |
|

|

