|
Conwy
Labour hold

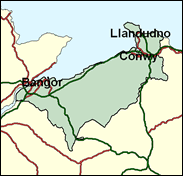
One of the most interesting battles in Wales, and indeed in the whole of the United Kingdom, can be expected in Conwy in North Wales at the next General Election. Last time, Labour's Betty Williams leapt from third to first, while the perennial Liberal Democrat, the Reverend Roger Roberts retained a close second and the Tories slipped to third. In the Assembly elections of May 1999 however, a fourth party entered the list as Plaid Cymru capped Betty's achievement by jumping from fourth to win the constituency. With the retirement of their trooper Roger Roberts, the Liberal Democrats can probably be written off as potential victors now, and the Conservatives still seem very weak, so the main battle may - perhaps - be between Labour and the Nationalists, with the former as favourites in a Westminster contest when voters' minds may be more concentrated on UK wide matters; and it should be remembered that the largest town in the seat, Llandudno, has only 20pc of Welsh speakers, and Conwy itself only 31pc.

Labour’s Betty Williams, after three years of unobtrusive loyalty apart from voting against disability benefit cuts (she has a disabled son), has latterly taken to resisting more generally, rebelling on restoring the link between pensions and average earnings, exempting policy advice from the Freedom of Information Bill, and air traffic control privatisation. Locally (Bangor) born (1944) and educated at Ysgol Dyffryn Nantlle Secondary School, Penygroes, and Bangor Normal College, she faces a confusing array of challengers. The Lib Dems are running Vicky Macdonald, born locally in 1945, educated at St Winifred’s School, Llanfairfechan, and teacher training college in Liverpool, and (as a mature student) Liverpool University. Briefly a teacher, she is now curator of the Royal Cambrian Academy in Conwy. For the Plaid is Ann Owen, seeking to confirm her party’s Welsh Assembly victory here. Again locally born (1959) and educated at Ysgol Dyffryn Nantlle, a health visitor by profession, she is currently doing an MA in Women’s Studies at Bangor University. The Conservative candidate is David Logan, a 39 year-old bearded farmer from distant Sussex.
 |
| Wealthy Achievers, Suburban Areas |
10.44% |
14.99% |
69.62 |
|
| Affluent Greys, Rural Communities |
3.13% |
2.13% |
147.38 |
|
| Prosperous Pensioners, Retirement Areas |
11.50% |
2.49% |
462.67 |
|
| Affluent Executives, Family Areas |
0.08% |
4.43% |
1.70 |
|
| Well-Off Workers, Family Areas |
1.74% |
7.27% |
23.87 |
|
| Affluent Urbanites, Town & City Areas |
3.29% |
2.56% |
128.10 |
|
| Prosperous Professionals, Metropolitan Areas |
0.00% |
2.04% |
0.00 |
|
| Better-Off Executives, Inner City Areas |
8.93% |
3.94% |
226.38 |
|
| Comfortable Middle Agers, Mature Home Owning Areas |
20.82% |
13.04% |
159.67 |
|
| Skilled Workers, Home Owning Areas |
5.18% |
12.70% |
40.81 |
|
| New Home Owners, Mature Communities |
15.97% |
8.14% |
196.17 |
|
| White Collar Workers, Better-Off Multi Ethnic Areas |
2.81% |
4.02% |
69.92 |
|
| Older People, Less Prosperous Areas |
3.89% |
3.19% |
122.08 |
|
| Council Estate Residents, Better-Off Homes |
10.15% |
11.31% |
89.73 |
|
| Council Estate Residents, High Unemployment |
0.59% |
3.06% |
19.33 |
|
| Council Estate Residents, Greatest Hardship |
1.46% |
2.52% |
57.83 |
|
| People in Multi-Ethnic, Low-Income Areas |
0.00% |
2.10% |
0.00 |
|
| Unclassified |
0.02% |
0.06% |
39.36 |
|
|
 |
 |
 |
| £0-5K |
11.19% |
9.41% |
118.84 |
|
| £5-10K |
20.09% |
16.63% |
120.80 |
|
| £10-15K |
19.27% |
16.58% |
116.23 |
|
| £15-20K |
14.82% |
13.58% |
109.14 |
|
| £20-25K |
10.51% |
10.39% |
101.17 |
|
| £25-30K |
7.24% |
7.77% |
93.15 |
|
| £30-35K |
4.95% |
5.79% |
85.50 |
|
| £35-40K |
3.40% |
4.33% |
78.40 |
|
| £40-45K |
2.35% |
3.27% |
71.94 |
|
| £45-50K |
1.64% |
2.48% |
66.12 |
|
| £50-55K |
1.16% |
1.90% |
60.90 |
|
| £55-60K |
0.83% |
1.47% |
56.23 |
|
| £60-65K |
0.60% |
1.15% |
52.06 |
|
| £65-70K |
0.44% |
0.91% |
48.33 |
|
| £70-75K |
0.32% |
0.72% |
45.00 |
|
| £75-80K |
0.24% |
0.57% |
42.00 |
|
| £80-85K |
0.18% |
0.46% |
39.31 |
|
| £85-90K |
0.14% |
0.37% |
36.89 |
|
| £90-95K |
0.11% |
0.31% |
34.70 |
|
| £95-100K |
0.08% |
0.25% |
32.71 |
|
| £100K + |
0.32% |
1.34% |
24.08 |
|
|
|

|


|
1992-1997
|
1997-2001
|
|
|
|
| Con |
-9.43% |
| Lab |
9.24% |
| LD |
-0.20% |
| PC |
-0.56% |
|
| Con |
-0.56% |
| Lab |
6.77% |
| LD |
-14.32% |
| PC |
9.64% |
|
|
 |
Betty Williams
Labour hold
|
| Con |
 |
8,147 |
23.71% |
| Lab |
 |
14,366 |
41.80% |
| LD |
 |
5,800 |
16.88% |
| PC |
 |
5,665 |
16.48% |
| Oth |
 |
388 |
1.13% |
| Maj |
 |
6,219 |
18.10% |
| Turn |
 |
34,366 |
62.77% |
|
|
 |
Betty Williams
Labour hold
|
| UK |
Alan Barham |
388 |
1.13% |
| C |
David Logan |
8,147 |
23.71% |
| LD |
Vicky Macdonald |
5,800 |
16.88% |
| PC |
Ann Owen |
5,665 |
16.48% |
| L |
Betty Williams |
14,366 |
41.80% |
|
Candidates representing 5 parties stood for election to this seat.
|
|
 |
Betty Williams
Labour gain
|
| Con |
 |
10,085 |
24.27% |
| Lab |
 |
14,561 |
35.04% |
| LD |
 |
12,965 |
31.20% |
| PC |
 |
2,844 |
6.84% |
| Ref |
 |
760 |
1.83% |
| Oth |
 |
345 |
0.83% |
| Maj |
 |
1,596 |
3.84% |
| Turn |
 |
41,560 |
75.44% |
|
|
 |
|
Conservative
|
| Con |
 |
14,250 |
33.70% |
| Lab |
 |
10,883 |
25.80% |
| LD |
 |
13,255 |
31.40% |
| PC |
 |
3,108 |
7.40% |
| Oth |
 |
751 |
1.80% |
| Maj |
 |
995 |
2.40% |
| Turn |
 |
42,247 |
77.56% |
|
|
 |
|

|

