|
Copeland
Labour hold

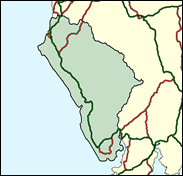
This is a low swinging seat in west Cumberland based on Whitehaven, the remote Millom, and the rugged Cleator Moor, Egremont and Frizington, but also reaching the western Lakes like Wastwater and Ennerdale Water and including England's highest peak, Scafell Pike. It has proved remarkably resistant to tampering by the Boundary Commissioners, although it has one of the smallest electorates in England at under 55,000. For thirty years it has been won by another survivor with a notably thick skin, Jack Cunningham, who has managed to combine being an environment spokesman (and later Agriculture Secretary and "Cabinet Enforcer" before resigning in October 1999) with representing this seat, which includes the Sellafield nuclear power establishment. His margins of victory have often been close, but Copeland has never quite got rid of him.

Dr Jack Cunningham (the doctorate is in chemistry from Durham University), dropped in 1999 as Cabinet Office minister, is lingering in the Commons at the age of 61 (born 1939) after 30 years. A junior minister in the 1970s - in the Callaghan government, after being Callaghan’s PPS - he was given the Agriculture Ministry in 1997 where he had to mop up after the BSE crisis. Previously outclassed by Douglas Hurd when shadowing him in Opposition, known unflatteringly as ‘Junket Jack’ and (by Brian Sedgemore) ‘Alderman Vanity’, he cuts a politically incorrect dash with ecologists for his constituency-linked advocacy of nuclear power and his former consultancy with chemical industry interests.
 |
| Wealthy Achievers, Suburban Areas |
7.68% |
14.99% |
51.24 |
|
| Affluent Greys, Rural Communities |
3.98% |
2.13% |
187.08 |
|
| Prosperous Pensioners, Retirement Areas |
0.03% |
2.49% |
1.21 |
|
| Affluent Executives, Family Areas |
2.36% |
4.43% |
53.26 |
|
| Well-Off Workers, Family Areas |
12.23% |
7.27% |
168.18 |
|
| Affluent Urbanites, Town & City Areas |
0.27% |
2.56% |
10.72 |
|
| Prosperous Professionals, Metropolitan Areas |
0.00% |
2.04% |
0.00 |
|
| Better-Off Executives, Inner City Areas |
0.61% |
3.94% |
15.47 |
|
| Comfortable Middle Agers, Mature Home Owning Areas |
6.75% |
13.04% |
51.79 |
|
| Skilled Workers, Home Owning Areas |
23.26% |
12.70% |
183.12 |
|
| New Home Owners, Mature Communities |
17.02% |
8.14% |
209.05 |
|
| White Collar Workers, Better-Off Multi Ethnic Areas |
0.68% |
4.02% |
16.84 |
|
| Older People, Less Prosperous Areas |
2.72% |
3.19% |
85.45 |
|
| Council Estate Residents, Better-Off Homes |
18.46% |
11.31% |
163.23 |
|
| Council Estate Residents, High Unemployment |
1.18% |
3.06% |
38.48 |
|
| Council Estate Residents, Greatest Hardship |
2.76% |
2.52% |
109.50 |
|
| People in Multi-Ethnic, Low-Income Areas |
0.00% |
2.10% |
0.00 |
|
| Unclassified |
0.00% |
0.06% |
0.00 |
|
|
 |
 |
 |
| £0-5K |
11.12% |
9.41% |
118.12 |
|
| £5-10K |
17.99% |
16.63% |
108.17 |
|
| £10-15K |
17.22% |
16.58% |
103.86 |
|
| £15-20K |
13.76% |
13.58% |
101.32 |
|
| £20-25K |
10.31% |
10.39% |
99.23 |
|
| £25-30K |
7.55% |
7.77% |
97.17 |
|
| £30-35K |
5.50% |
5.79% |
95.02 |
|
| £35-40K |
4.02% |
4.33% |
92.78 |
|
| £40-45K |
2.95% |
3.27% |
90.50 |
|
| £45-50K |
2.19% |
2.48% |
88.21 |
|
| £50-55K |
1.64% |
1.90% |
85.94 |
|
| £55-60K |
1.23% |
1.47% |
83.72 |
|
| £60-65K |
0.94% |
1.15% |
81.55 |
|
| £65-70K |
0.72% |
0.91% |
79.45 |
|
| £70-75K |
0.56% |
0.72% |
77.43 |
|
| £75-80K |
0.43% |
0.57% |
75.49 |
|
| £80-85K |
0.34% |
0.46% |
73.62 |
|
| £85-90K |
0.27% |
0.37% |
71.82 |
|
| £90-95K |
0.21% |
0.31% |
70.11 |
|
| £95-100K |
0.17% |
0.25% |
68.46 |
|
| £100K + |
0.79% |
1.34% |
59.13 |
|
|
|

|


|
1992-1997
|
1997-2001
|
|
|
|
| Con |
-14.18% |
| Lab |
9.41% |
| LD |
1.62% |
|
| Con |
8.27% |
| Lab |
-6.34% |
| LD |
1.51% |
|
|
 |
Jack Cunningham
Labour hold
|
| Con |
 |
13,027 |
37.49% |
| Lab |
 |
17,991 |
51.77% |
| LD |
 |
3,732 |
10.74% |
| Oth |
|
0 |
0.00% |
| Maj |
 |
4,964 |
14.28% |
| Turn |
 |
34,750 |
64.92% |
|
|
 |
Jack Cunningham
Labour hold
|
| L |
Jack Cunningham |
17,991 |
51.77% |
| LD |
Mark Gayler |
3,732 |
10.74% |
| C |
Mike Graham |
13,027 |
37.49% |
|
Candidates representing 3 parties stood for election to this seat.
|
|
 |
Jack Cunningham
Labour
|
| Con |
 |
12,081 |
29.22% |
| Lab |
 |
24,025 |
58.11% |
| LD |
 |
3,814 |
9.22% |
| Ref |
 |
1,036 |
2.51% |
| Oth |
 |
389 |
0.94% |
| Maj |
 |
11,944 |
28.89% |
| Turn |
 |
41,345 |
76.19% |
|
|
 |
|
Labour
|
| Con |
 |
19,889 |
43.40% |
| Lab |
 |
22,328 |
48.70% |
| LD |
 |
3,508 |
7.60% |
| Oth |
 |
148 |
0.30% |
| Maj |
 |
2,439 |
5.30% |
| Turn |
 |
45,873 |
82.58% |
|
|
 |
|

|

