|
Corby
Conservative gain

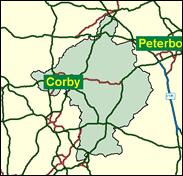
It might seem counter-intuitive, but Corby, that heavy industrial outpost in rural Northamptonshire, with its inter war steelworks and its post World War II new town development, did not elect a Labour MP for 14 years after it received its own seat in 1983; this in a place with Orange Lodges and a Rangers FC Social Club, belying the west of Scotland roots of many of the workers who migrated in search of employment. It shows how depressed Old Labour was in 1983, 1987, and only half recovered in 1992. There is also the matter of the delightful north Northants countryside, with the warm honey coloured stone villages which start just outside the anomalous Corby's boundaries (Rockingham Castle is but a couple of miles away), which includes the bijou small town of Oundle, dominated on its north side at least by its sprawling and clearly highly affluent independent secondary school. Here too is Irthlingborough, the site of the most recent addition to the Football League, Rushden and Diamonds, whose Nene Park stadium is cheek by jowl with the footwear factory of R Griggs, known for Doc Marten's boots (Max Griggs is the chairman and benefactor of Diamonds). Rushden itself, though but three miles away, is in the super-close Wellingborough division. However, Corby is scarcely a marginal any more: in 1997 Phil Hope won by nearly 12,000, and it may well be another dozen or so years before the Conservatives are competitive again.

Phil Hope, Labour victor here in 1997, and PPS to Nick Raynsford, is a loyalist bowler of stooge questions. Son of a Metropolitan Police Commander, born 1955, educated at Wandsworth School and St Luke’s College, Exeter. A former teacher and community worker, he backs the European Union for its aid to the ex-steel town of Corby. A one-time tap dancer, he has yet to do so at Prime Minister’s Question time.
 |
| Wealthy Achievers, Suburban Areas |
13.86% |
14.99% |
92.45 |
|
| Affluent Greys, Rural Communities |
1.87% |
2.13% |
87.91 |
|
| Prosperous Pensioners, Retirement Areas |
0.50% |
2.49% |
20.20 |
|
| Affluent Executives, Family Areas |
8.09% |
4.43% |
182.87 |
|
| Well-Off Workers, Family Areas |
8.95% |
7.27% |
123.06 |
|
| Affluent Urbanites, Town & City Areas |
1.15% |
2.56% |
44.89 |
|
| Prosperous Professionals, Metropolitan Areas |
0.00% |
2.04% |
0.00 |
|
| Better-Off Executives, Inner City Areas |
0.00% |
3.94% |
0.00 |
|
| Comfortable Middle Agers, Mature Home Owning Areas |
13.70% |
13.04% |
105.10 |
|
| Skilled Workers, Home Owning Areas |
13.79% |
12.70% |
108.55 |
|
| New Home Owners, Mature Communities |
13.41% |
8.14% |
164.69 |
|
| White Collar Workers, Better-Off Multi Ethnic Areas |
0.32% |
4.02% |
7.83 |
|
| Older People, Less Prosperous Areas |
2.61% |
3.19% |
82.08 |
|
| Council Estate Residents, Better-Off Homes |
19.65% |
11.31% |
173.77 |
|
| Council Estate Residents, High Unemployment |
0.43% |
3.06% |
14.05 |
|
| Council Estate Residents, Greatest Hardship |
1.63% |
2.52% |
64.86 |
|
| People in Multi-Ethnic, Low-Income Areas |
0.00% |
2.10% |
0.00 |
|
| Unclassified |
0.02% |
0.06% |
33.92 |
|
|
 |
 |
 |
| £0-5K |
7.83% |
9.41% |
83.14 |
|
| £5-10K |
16.35% |
16.63% |
98.33 |
|
| £10-15K |
17.50% |
16.58% |
105.54 |
|
| £15-20K |
14.60% |
13.58% |
107.47 |
|
| £20-25K |
11.08% |
10.39% |
106.60 |
|
| £25-30K |
8.12% |
7.77% |
104.50 |
|
| £30-35K |
5.91% |
5.79% |
102.03 |
|
| £35-40K |
4.32% |
4.33% |
99.60 |
|
| £40-45K |
3.18% |
3.27% |
97.39 |
|
| £45-50K |
2.37% |
2.48% |
95.45 |
|
| £50-55K |
1.79% |
1.90% |
93.79 |
|
| £55-60K |
1.36% |
1.47% |
92.38 |
|
| £60-65K |
1.05% |
1.15% |
91.19 |
|
| £65-70K |
0.82% |
0.91% |
90.18 |
|
| £70-75K |
0.64% |
0.72% |
89.33 |
|
| £75-80K |
0.51% |
0.57% |
88.61 |
|
| £80-85K |
0.41% |
0.46% |
88.00 |
|
| £85-90K |
0.33% |
0.37% |
87.47 |
|
| £90-95K |
0.27% |
0.31% |
87.02 |
|
| £95-100K |
0.22% |
0.25% |
86.63 |
|
| £100K + |
1.14% |
1.34% |
85.10 |
|
|
|

|


|
1992-1997
|
1997-2001
|
|
|
|
| Con |
-11.09% |
| Lab |
11.49% |
| LD |
-2.70% |
|
| Con |
3.82% |
| Lab |
-55.39% |
| LD |
2.56% |
|
|
 |
Phil Hope
Conservative gain
|
| Con |
 |
17,583 |
37.23% |
| Lab |
|
0 |
0.00% |
| LD |
 |
4,751 |
10.06% |
| Oth |
 |
24,888 |
52.70% |
| Maj |
 |
12,832 |
27.17% |
| Turn |
 |
47,222 |
65.31% |
|
|
 |
Phil Hope
Conservative gain
|
| SL |
Andrew Dickson |
750 |
1.59% |
| UK |
Ian Gillman |
855 |
1.81% |
| C |
Andrew Griffith |
17,583 |
37.23% |
| LC |
Phil Hope |
23,283 |
49.31% |
| LD |
Kevin Scudder |
4,751 |
10.06% |
|
Candidates representing 5 parties stood for election to this seat.
|
|
 |
Philip Hope
Labour gain
|
| Con |
 |
18,028 |
33.41% |
| Lab |
 |
29,888 |
55.39% |
| LD |
 |
4,045 |
7.50% |
| Ref |
 |
1,356 |
2.51% |
| Oth |
 |
640 |
1.19% |
| Maj |
 |
11,860 |
21.98% |
| Turn |
 |
53,957 |
77.91% |
|
|
 |
|
Conservative
|
| Con |
 |
25,203 |
44.50% |
| Lab |
 |
24,861 |
43.90% |
| LD |
 |
5,792 |
10.20% |
| Oth |
 |
784 |
1.40% |
| Maj |
 |
342 |
0.60% |
| Turn |
 |
56,640 |
81.87% |
|
|
 |
|

|

