|
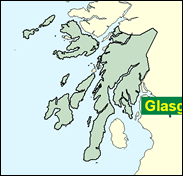
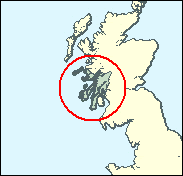
Argyll & Bute
Liberal Democrat hold

Ray Michie, the Liberal Democrat MP for this vast west coast seat - which includes Mull, Islay, and Jura - announced her decision not to contest it for a sixth time. It will not be easy to predict who her successor will be, although the omens of the Scottish Parliament elections in 1999 are good for her party, as their candidate George Lyon held off an SNP challenge by just over 2,000 votes. It is possible in a Westminster election, now the Edinburgh Parliament has been established, that the SNP's appeal may be weaker than this.

To follow retiring Ray Michie, the Liberal Democrats at first chose Paisley University lecturer and local councillor Paul Coleshill, who very much unlike Mrs Michie favoured homosexual law reform, but who has resigned as candidate and been replaced by Alan Reid, a computer project manager born 1954 and educated at Prestwick Academy, Ayr Academy and Strathclyde University, and who was for eight years a Renfrew councillor. This slight blip will encourage the SNP, who are targeting the seat with Agnes Samuel, born 1949, Lanark Grammar School and Glasgow University-educated Director of Glasgow Opportunities Enterprise Trust, and earlier a language teacher. With experience as an SNP staffer at Westminster during the heady days of the 'seventies when the Nationalists had eleven MPs, she appears rather less green than many of her party's current crop of candidates.

 |
| Wealthy Achievers, Suburban Areas |
5.34% |
14.99% |
35.65 |
|
| Affluent Greys, Rural Communities |
26.71% |
2.13% |
1,256.20 |
|
| Prosperous Pensioners, Retirement Areas |
1.91% |
2.49% |
76.79 |
|
| Affluent Executives, Family Areas |
2.33% |
4.43% |
52.57 |
|
| Well-Off Workers, Family Areas |
3.27% |
7.27% |
45.02 |
|
| Affluent Urbanites, Town & City Areas |
0.47% |
2.56% |
18.14 |
|
| Prosperous Professionals, Metropolitan Areas |
0.07% |
2.04% |
3.54 |
|
| Better-Off Executives, Inner City Areas |
2.32% |
3.94% |
58.72 |
|
| Comfortable Middle Agers, Mature Home Owning Areas |
13.37% |
13.04% |
102.56 |
|
| Skilled Workers, Home Owning Areas |
1.45% |
12.70% |
11.45 |
|
| New Home Owners, Mature Communities |
8.08% |
8.14% |
99.17 |
|
| White Collar Workers, Better-Off Multi Ethnic Areas |
5.23% |
4.02% |
130.02 |
|
| Older People, Less Prosperous Areas |
6.36% |
3.19% |
199.78 |
|
| Council Estate Residents, Better-Off Homes |
12.45% |
11.31% |
110.11 |
|
| Council Estate Residents, High Unemployment |
6.41% |
3.06% |
209.45 |
|
| Council Estate Residents, Greatest Hardship |
4.22% |
2.52% |
167.50 |
|
| People in Multi-Ethnic, Low-Income Areas |
0.00% |
2.10% |
0.00 |
|
| Unclassified |
0.00% |
0.06% |
0.00 |
|
|
 |
|
|
| £0-5K |
10.62% |
9.41% |
112.79 |
|
| £5-10K |
19.49% |
16.63% |
117.21 |
|
| £10-15K |
18.82% |
16.58% |
113.53 |
|
| £15-20K |
14.51% |
13.58% |
106.82 |
|
| £20-25K |
10.37% |
10.39% |
99.76 |
|
| £25-30K |
7.25% |
7.77% |
93.28 |
|
| £30-35K |
5.07% |
5.79% |
87.57 |
|
| £35-40K |
3.58% |
4.33% |
82.57 |
|
| £40-45K |
2.55% |
3.27% |
78.16 |
|
| £45-50K |
1.84% |
2.48% |
74.25 |
|
| £50-55K |
1.35% |
1.90% |
70.75 |
|
| £55-60K |
1.00% |
1.47% |
67.60 |
|
| £60-65K |
0.75% |
1.15% |
64.74 |
|
| £65-70K |
0.56% |
0.91% |
62.14 |
|
| £70-75K |
0.43% |
0.72% |
59.75 |
|
| £75-80K |
0.33% |
0.57% |
57.56 |
|
| £80-85K |
0.26% |
0.46% |
55.55 |
|
| £85-90K |
0.20% |
0.37% |
53.68 |
|
| £90-95K |
0.16% |
0.31% |
51.95 |
|
| £95-100K |
0.13% |
0.25% |
50.34 |
|
| £100K + |
0.57% |
1.34% |
42.45 |
|
|
|
|


|
1992-1997
|
1997-2001
|
|
|
|
| Con |
-8.74% |
| Lab |
2.07% |
| LD |
5.30% |
| SNP |
-0.63% |
|
| Con |
1.83% |
| Lab |
8.86% |
| LD |
-10.33% |
| SNP |
-2.39% |
|
|
|
Alan Reid
Liberal Democrat hold
|
| Con |
 |
6,436 |
20.79% |
| Lab |
 |
7,592 |
24.52% |
| LD |
 |
9,245 |
29.86% |
| SNP |
 |
6,433 |
20.78% |
| Oth |
 |
1,251 |
4.04% |
| Maj |
 |
1,653 |
5.34% |
| Turn |
|
30,957 |
62.95% |
|
|
|
Alan Reid
Liberal Democrat hold
|
| SSP |
Des Divers |
1,251 |
4.04% |
| C |
David Petrie |
6,436 |
20.79% |
| L |
Hugh Raven |
7,592 |
24.52% |
| LD |
Alan Reid |
9,245 |
29.86% |
| SNP |
Anges Samuel |
6,433 |
20.78% |
|
Candidates representing 5 parties stood for election to this seat.
|
|
|
Ray Michie
Liberal Democrat
|
| Con |
|
6,774 |
18.96% |
| Lab |
|
5,596 |
15.67% |
| LD |
|
14,359 |
40.20% |
| SNP |
|
8,278 |
23.17% |
| Ref |
 |
713 |
2.00% |
| Oth |
|
0 |
0.00% |
| Maj |
|
6,081 |
17.02% |
| Turn |
|
35,720 |
72.23% |
|
|
|
|
Liberal Democrat
|
| Con |
|
10,117 |
27.70% |
| Lab |
|
4,946 |
13.60% |
| LD |
|
12,739 |
34.90% |
| SNP |
|
8,689 |
23.80% |
| Oth |
|
0 |
0.00% |
| Maj |
|
2,622 |
7.20% |
| Turn |
|
36,491 |
75.34% |
|
|
|
|
|