|
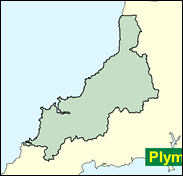
Cornwall North
Liberal Democrat hold

This seat has the largest numerical Liberal Democrat majority, 13,933, and the MP since 1992 (and also for eight months in 1974, although that was for the seat named Bodmin) Paul Tyler has been vociferous in defending "local" interests, for example against noisy if privileged teenagers at the fashionable resort of Rock. His position seems impregnable.

Paul Tyler, Liberal Democrat Chief Whip, won here in 1992 after seven months as MP for Bodmin in 1974. Born 1941, churchy, public-school-and-Oxford (Sherborne and Exeter College) educated, he uses dated RP speech and has hair wrapped over a balding pate. He wisely pulled out from the standing-room-only Lib Dem leadership race in 2000. Inevitably in his Party’s mode - an assiduous constituency MP on fishing, farming and tourism - he can sound Eurosceptic, confronting as he does the contradiction between his party’s Europhile history and its Eurosceptic electoral support.
 |
| Wealthy Achievers, Suburban Areas |
2.18% |
14.99% |
14.55 |
|
| Affluent Greys, Rural Communities |
34.64% |
2.13% |
1,629.32 |
|
| Prosperous Pensioners, Retirement Areas |
6.83% |
2.49% |
274.56 |
|
| Affluent Executives, Family Areas |
0.99% |
4.43% |
22.38 |
|
| Well-Off Workers, Family Areas |
1.70% |
7.27% |
23.42 |
|
| Affluent Urbanites, Town & City Areas |
0.00% |
2.56% |
0.00 |
|
| Prosperous Professionals, Metropolitan Areas |
0.00% |
2.04% |
0.00 |
|
| Better-Off Executives, Inner City Areas |
2.04% |
3.94% |
51.62 |
|
| Comfortable Middle Agers, Mature Home Owning Areas |
20.89% |
13.04% |
160.23 |
|
| Skilled Workers, Home Owning Areas |
4.89% |
12.70% |
38.51 |
|
| New Home Owners, Mature Communities |
11.90% |
8.14% |
146.14 |
|
| White Collar Workers, Better-Off Multi Ethnic Areas |
4.84% |
4.02% |
120.27 |
|
| Older People, Less Prosperous Areas |
1.72% |
3.19% |
53.84 |
|
| Council Estate Residents, Better-Off Homes |
6.23% |
11.31% |
55.08 |
|
| Council Estate Residents, High Unemployment |
0.00% |
3.06% |
0.15 |
|
| Council Estate Residents, Greatest Hardship |
0.74% |
2.52% |
29.32 |
|
| People in Multi-Ethnic, Low-Income Areas |
0.00% |
2.10% |
0.00 |
|
| Unclassified |
0.41% |
0.06% |
655.94 |
|
|
 |
 |
 |
| £0-5K |
12.50% |
9.41% |
132.78 |
|
| £5-10K |
22.09% |
16.63% |
132.79 |
|
| £10-15K |
20.21% |
16.58% |
121.88 |
|
| £15-20K |
14.76% |
13.58% |
108.63 |
|
| £20-25K |
9.95% |
10.39% |
95.76 |
|
| £25-30K |
6.54% |
7.77% |
84.18 |
|
| £30-35K |
4.29% |
5.79% |
74.10 |
|
| £35-40K |
2.84% |
4.33% |
65.45 |
|
| £40-45K |
1.90% |
3.27% |
58.07 |
|
| £45-50K |
1.29% |
2.48% |
51.79 |
|
| £50-55K |
0.88% |
1.90% |
46.42 |
|
| £55-60K |
0.62% |
1.47% |
41.82 |
|
| £60-65K |
0.44% |
1.15% |
37.87 |
|
| £65-70K |
0.31% |
0.91% |
34.45 |
|
| £70-75K |
0.23% |
0.72% |
31.49 |
|
| £75-80K |
0.17% |
0.57% |
28.90 |
|
| £80-85K |
0.12% |
0.46% |
26.63 |
|
| £85-90K |
0.09% |
0.37% |
24.62 |
|
| £90-95K |
0.07% |
0.31% |
22.85 |
|
| £95-100K |
0.05% |
0.25% |
21.28 |
|
| £100K + |
0.20% |
1.34% |
14.88 |
|
|
|

|


|
1992-1997
|
1997-2001
|
|
|
|
| Con |
-14.85% |
| Lab |
2.83% |
| LD |
5.84% |
|
| Con |
-19.71% |
| Lab |
24.38% |
| LD |
-1.22% |
|
|
 |
Paul Tyler
Liberal Democrat hold
|
| Con |
 |
5,257 |
9.74% |
| Lab |
 |
18,250 |
33.81% |
| LD |
 |
28,082 |
52.02% |
| Oth |
 |
2,394 |
4.43% |
| Maj |
 |
9,832 |
18.21% |
| Turn |
 |
53,983 |
63.76% |
|
|
 |
Paul Tyler
Liberal Democrat hold
|
| C |
Mike Goodman |
5,257 |
9.74% |
| UK |
Steve Protz |
2,394 |
4.43% |
| LD |
Paul Tyler |
28,082 |
52.02% |
| L |
John Weller |
18,250 |
33.81% |
|
Candidates representing 4 parties stood for election to this seat.
|
|
 |
Paul Tyler
Liberal Democrat
|
| Con |
 |
17,253 |
29.45% |
| Lab |
 |
5,523 |
9.43% |
| LD |
 |
31,186 |
53.24% |
| Ref |
 |
3,636 |
6.21% |
| Oth |
 |
983 |
1.68% |
| Maj |
 |
13,933 |
23.78% |
| Turn |
 |
58,581 |
73.16% |
|
|
 |
|
Liberal Democrat
|
| Con |
 |
27,775 |
44.30% |
| Lab |
 |
4,103 |
6.60% |
| LD |
 |
29,696 |
47.40% |
| Oth |
 |
1,066 |
1.70% |
| Maj |
 |
1,921 |
3.10% |
| Turn |
 |
62,640 |
81.56% |
|
|
 |
|

|

