|
Coventry North East
Labour hold

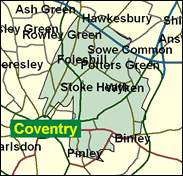
North East has been within living memory and according to recorded evidence the most favourable quadrant of the West Midlands city to the Labour party. 1997 proved no exception, as Bob Ainsworth won with a majority of over 22,500, the highest anywhere in the city since the end of World War Two, after a massive 16.6pc rise in the Labour share of the vote. The neighbourhoods are varied, but mainly solid for Labour: Foleshill ward north of the city centre contains the massive Courtaulds works and over 50pc of its residents are non-white, mostly of Indian origin. Henley, on the other hand, is a peripheral ward with Coventry's highest proportion of council housing (35pc in 1991). there are some Conservative voters in wards like Wyken, but even in a relatively good year for them like 2000 they could only win in it in the May council elections by 54 votes. There may be a swing back to the Tories in 2001, but it will barely dent the edifice Labour have constructed here.

Bob Ainsworth, a Labour Whip for five years until 2001, comes, as Labour Whips habitually do, from his party’s proletarian core, as a former Jaguar sheet metal worker and shop steward. A former deputy leader of Coventry Council, born 1952, educated at Foxford Comprehensive School, he was elected first here in 1992 as a safe replacement for the hard left Campaign Group rebel, John Hughes. In January 2001 he benefited from the reshuffle after the second going of Peter Mandelson by becoming a junior minister at the Department of Environment, Transport & the Regions.
 |
| Wealthy Achievers, Suburban Areas |
0.00% |
14.99% |
0.00 |
|
| Affluent Greys, Rural Communities |
0.00% |
2.13% |
0.00 |
|
| Prosperous Pensioners, Retirement Areas |
0.00% |
2.49% |
0.00 |
|
| Affluent Executives, Family Areas |
0.15% |
4.43% |
3.47 |
|
| Well-Off Workers, Family Areas |
4.24% |
7.27% |
58.27 |
|
| Affluent Urbanites, Town & City Areas |
1.40% |
2.56% |
54.40 |
|
| Prosperous Professionals, Metropolitan Areas |
0.00% |
2.04% |
0.00 |
|
| Better-Off Executives, Inner City Areas |
0.98% |
3.94% |
24.86 |
|
| Comfortable Middle Agers, Mature Home Owning Areas |
0.81% |
13.04% |
6.21 |
|
| Skilled Workers, Home Owning Areas |
45.14% |
12.70% |
355.38 |
|
| New Home Owners, Mature Communities |
3.82% |
8.14% |
46.91 |
|
| White Collar Workers, Better-Off Multi Ethnic Areas |
2.46% |
4.02% |
61.17 |
|
| Older People, Less Prosperous Areas |
3.25% |
3.19% |
102.11 |
|
| Council Estate Residents, Better-Off Homes |
21.64% |
11.31% |
191.29 |
|
| Council Estate Residents, High Unemployment |
3.34% |
3.06% |
109.05 |
|
| Council Estate Residents, Greatest Hardship |
8.07% |
2.52% |
320.49 |
|
| People in Multi-Ethnic, Low-Income Areas |
4.70% |
2.10% |
223.86 |
|
| Unclassified |
0.00% |
0.06% |
0.00 |
|
|
 |
|
|
| £0-5K |
14.24% |
9.41% |
151.22 |
|
| £5-10K |
22.24% |
16.63% |
133.72 |
|
| £10-15K |
19.58% |
16.58% |
118.13 |
|
| £15-20K |
14.19% |
13.58% |
104.47 |
|
| £20-25K |
9.62% |
10.39% |
92.56 |
|
| £25-30K |
6.39% |
7.77% |
82.20 |
|
| £30-35K |
4.24% |
5.79% |
73.24 |
|
| £35-40K |
2.84% |
4.33% |
65.50 |
|
| £40-45K |
1.92% |
3.27% |
58.81 |
|
| £45-50K |
1.32% |
2.48% |
53.03 |
|
| £50-55K |
0.91% |
1.90% |
48.02 |
|
| £55-60K |
0.64% |
1.47% |
43.67 |
|
| £60-65K |
0.46% |
1.15% |
39.88 |
|
| £65-70K |
0.33% |
0.91% |
36.55 |
|
| £70-75K |
0.24% |
0.72% |
33.63 |
|
| £75-80K |
0.18% |
0.57% |
31.05 |
|
| £80-85K |
0.13% |
0.46% |
28.77 |
|
| £85-90K |
0.10% |
0.37% |
26.74 |
|
| £90-95K |
0.08% |
0.31% |
24.93 |
|
| £95-100K |
0.06% |
0.25% |
23.31 |
|
| £100K + |
0.22% |
1.34% |
16.58 |
|
|
|
|


|
1992-1997
|
1997-2001
|
|
|
|
| Con |
-8.69% |
| Lab |
16.65% |
| LD |
-2.46% |
|
| Con |
-0.56% |
| Lab |
-5.23% |
| LD |
3.13% |
|
|
|
Bob Ainsworth
Labour hold
|
| Con |
 |
6,988 |
18.75% |
| Lab |
 |
22,739 |
61.02% |
| LD |
 |
4,163 |
11.17% |
| Oth |
 |
3,375 |
9.06% |
| Maj |
 |
15,751 |
42.27% |
| Turn |
|
37,265 |
50.36% |
|
|
|
Bob Ainsworth
Labour hold
|
| L |
Bob Ainsworth |
22,739 |
61.02% |
| C |
Gordon Bell |
6,988 |
18.75% |
| SA |
Dave Nellist |
2,638 |
7.08% |
| LD |
Geoffrey Sewards |
4,163 |
11.17% |
| BNP |
Edward Sheppard |
737 |
1.98% |
|
Candidates representing 5 parties stood for election to this seat.
|
|
|
Bob Ainsworth
Labour
|
| Con |
|
9,287 |
19.31% |
| Lab |
|
31,856 |
66.25% |
| LD |
|
3,866 |
8.04% |
| Ref |
 |
1,125 |
2.34% |
| Oth |
|
1,951 |
4.06% |
| Maj |
|
22,569 |
46.94% |
| Turn |
|
48,085 |
64.74% |
|
|
|
|
Labour
|
| Con |
|
15,854 |
28.00% |
| Lab |
|
28,083 |
49.60% |
| LD |
|
5,948 |
10.50% |
| Oth |
|
6,696 |
11.80% |
| Maj |
|
12,229 |
21.60% |
| Turn |
|
56,581 |
72.84% |
|
|
|
|
|