|
Coventry North West
Labour hold

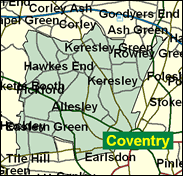
One of the more controversial MPs in the Commons is Geoffrey Robinson, the former Paymaster General, author of one book, a much publicised "expose" of dealings in the New Labour government, and subject of another, by investigative biographer Tom Bower. Yet for a quarter of a century his Coventry North West seat - and local party - has proved remarkably loyal to him, and he has again been reselected and should expect to be comfortably returned again to Westminster. The Conservatives outpolled Labour over the aggregate of the voting in the six Coventry city wards included here in May 2000, winning the wards of Bablake, Sherbourne Whoberley and Woodlands, but that was a bad year for Labour in local government in the west Midlands, when the Tories matched them in winning eight wards each on the council. In a traditionally low swinging seat it would be very unlikely if Labour, even with Robinson as candidate, should suffer a 16pc negative swing in a General Election, here in the home constituency of Jaguar cars, of which the MP was once Managing Director.

Geoffrey Robinson, a millionaire businessman and Labour’s richest MP, was sacked from the government in December 1998 following revelations about his house loan to Peter Mandelson, and persistent Tory queries about his offshore tax arrangements and his former links to Robert Maxwell. Made rich through his transfer technology company (until its collapse in 1999) and by a huge bequest from a rich Belgian widow, he saved - by buying - the New Statesman and helped fund Labour in opposition. Born 1938, educated at Emanuel School, London, Clare College Cambridge and Yale, he was first elected in 1976 after working at Transport House and running Jaguar cars.
 |
| Wealthy Achievers, Suburban Areas |
1.43% |
14.99% |
9.51 |
|
| Affluent Greys, Rural Communities |
0.00% |
2.13% |
0.00 |
|
| Prosperous Pensioners, Retirement Areas |
0.25% |
2.49% |
9.96 |
|
| Affluent Executives, Family Areas |
1.85% |
4.43% |
41.76 |
|
| Well-Off Workers, Family Areas |
5.01% |
7.27% |
68.93 |
|
| Affluent Urbanites, Town & City Areas |
1.55% |
2.56% |
60.55 |
|
| Prosperous Professionals, Metropolitan Areas |
0.04% |
2.04% |
1.93 |
|
| Better-Off Executives, Inner City Areas |
2.35% |
3.94% |
59.56 |
|
| Comfortable Middle Agers, Mature Home Owning Areas |
9.73% |
13.04% |
74.60 |
|
| Skilled Workers, Home Owning Areas |
47.54% |
12.70% |
374.22 |
|
| New Home Owners, Mature Communities |
4.75% |
8.14% |
58.31 |
|
| White Collar Workers, Better-Off Multi Ethnic Areas |
2.09% |
4.02% |
52.08 |
|
| Older People, Less Prosperous Areas |
5.25% |
3.19% |
164.89 |
|
| Council Estate Residents, Better-Off Homes |
13.71% |
11.31% |
121.22 |
|
| Council Estate Residents, High Unemployment |
2.68% |
3.06% |
87.44 |
|
| Council Estate Residents, Greatest Hardship |
1.77% |
2.52% |
70.47 |
|
| People in Multi-Ethnic, Low-Income Areas |
0.00% |
2.10% |
0.00 |
|
| Unclassified |
0.00% |
0.06% |
0.00 |
|
|
 |
 |
 |
| £0-5K |
11.04% |
9.41% |
117.25 |
|
| £5-10K |
19.05% |
16.63% |
114.53 |
|
| £10-15K |
18.44% |
16.58% |
111.20 |
|
| £15-20K |
14.48% |
13.58% |
106.57 |
|
| £20-25K |
10.52% |
10.39% |
101.23 |
|
| £25-30K |
7.44% |
7.77% |
95.66 |
|
| £30-35K |
5.22% |
5.79% |
90.20 |
|
| £35-40K |
3.68% |
4.33% |
84.99 |
|
| £40-45K |
2.62% |
3.27% |
80.14 |
|
| £45-50K |
1.88% |
2.48% |
75.65 |
|
| £50-55K |
1.36% |
1.90% |
71.54 |
|
| £55-60K |
1.00% |
1.47% |
67.79 |
|
| £60-65K |
0.74% |
1.15% |
64.36 |
|
| £65-70K |
0.56% |
0.91% |
61.24 |
|
| £70-75K |
0.42% |
0.72% |
58.39 |
|
| £75-80K |
0.32% |
0.57% |
55.79 |
|
| £80-85K |
0.25% |
0.46% |
53.40 |
|
| £85-90K |
0.19% |
0.37% |
51.22 |
|
| £90-95K |
0.15% |
0.31% |
49.22 |
|
| £95-100K |
0.12% |
0.25% |
47.37 |
|
| £100K + |
0.52% |
1.34% |
38.78 |
|
|
|

|


|
1992-1997
|
1997-2001
|
|
|
|
| Con |
-10.68% |
| Lab |
5.68% |
| LD |
-1.33% |
|
| Con |
-0.43% |
| Lab |
-5.44% |
| LD |
3.23% |
|
|
 |
Geoffrey Robinson
Labour hold
|
| Con |
 |
11,018 |
25.89% |
| Lab |
 |
21,892 |
51.45% |
| LD |
 |
5,832 |
13.71% |
| Oth |
 |
3,809 |
8.95% |
| Maj |
 |
10,874 |
25.56% |
| Turn |
 |
42,551 |
55.51% |
|
|
 |
Geoffrey Robinson
Labour hold
|
| UK |
Mark Benson |
650 |
1.53% |
| C |
Andrew Fairburn |
11,018 |
25.89% |
| I |
Christine Oddy |
3,159 |
7.42% |
| LD |
Napier Penlington |
5,832 |
13.71% |
| L |
Geoffrey Robinson |
21,892 |
51.45% |
|
Candidates representing 5 parties stood for election to this seat.
|
|
 |
Geoffrey Robinson
Labour
|
| Con |
 |
14,300 |
26.32% |
| Lab |
 |
30,901 |
56.88% |
| LD |
 |
5,690 |
10.47% |
| Ref |
 |
1,269 |
2.34% |
| Oth |
 |
2,162 |
3.98% |
| Maj |
 |
16,601 |
30.56% |
| Turn |
 |
54,322 |
71.07% |
|
|
 |
|
Labour
|
| Con |
 |
22,425 |
37.00% |
| Lab |
 |
31,083 |
51.20% |
| LD |
 |
7,152 |
11.80% |
| Oth |
|
0 |
0.00% |
| Maj |
 |
8,658 |
14.30% |
| Turn |
 |
60,660 |
76.60% |
|
|
 |
|

|

