|
Coventry South
Labour hold

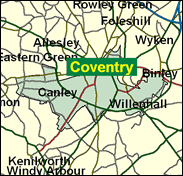
The curious recent history of this part of Coventry has more or less worked itself out, now, one imagines. This all stems from the impact of an individual MP, Dave Nellist, a sincere Left-wing socialist who was expelled from the Labour party in 1991 because of his close associations with the Militant Tendency. In 1992 he stood as an independent in his seat, then named Coventry South East, and did remarkably well, polling over 10,000 votes and turning the race into a thrilling three way photo-finish with the Conservatives and official Labour in the shape of Jim Cunningham, who narrowly won. Nellist tried again in 1997, but this time he was not the incumbent, New Labour was popular and boundary changes brought in territory from the South West seat which Nellist had never represented (indeed, had been Conservative). Dave Nellist only just saved his deposit, Cunningham increased his vote by 16pc and romped home over another sitting member, John Butcher of South West. This is still the least strong of the three Labour seats in Coventry, but it should be able to resist an 11pc swing to the Tories in a General Election. Although the ex-South West wards of Earlsdon and Wainbody are the safest Tory leafy residential areas within the city boundaries, they are counterbalanced by St Michael's, which covers the city centre shattered by air raids during the Second War, and home to Coventry;s seciond largest non-white concentration of residents after Foleshill in North West; and Westwood and Binley / Willenhall with their council estates. However, in the city council elections of May 2000 the Conservatives polled more votes and a "Socialist Alternative" candidate beat Labour to win the central St Michael's , so Cunningham must still watch out for threats from his right and his left.

Emigré Scot Jim Cunningham, a rare Labour blue-collar worker - only 54 out of 418 MPs in 1997 - is an orthodox trade union loyalist, elected in 1992 as the ouster of the Militant-linked MP Dave Nellist Born 1941, educated at St Columbe (RC) High School, Coatbridge, he holed up in Coventry as an engineer at Rolls Royce for 20 years, and member - eventually leader - of Coventry City Council. He has campaigned for airport safety following a local crash in 1995.
 |
| Wealthy Achievers, Suburban Areas |
15.93% |
14.99% |
106.24 |
|
| Affluent Greys, Rural Communities |
0.00% |
2.13% |
0.00 |
|
| Prosperous Pensioners, Retirement Areas |
0.43% |
2.49% |
17.11 |
|
| Affluent Executives, Family Areas |
1.06% |
4.43% |
23.96 |
|
| Well-Off Workers, Family Areas |
3.51% |
7.27% |
48.26 |
|
| Affluent Urbanites, Town & City Areas |
3.28% |
2.56% |
127.99 |
|
| Prosperous Professionals, Metropolitan Areas |
0.13% |
2.04% |
6.46 |
|
| Better-Off Executives, Inner City Areas |
4.15% |
3.94% |
105.22 |
|
| Comfortable Middle Agers, Mature Home Owning Areas |
11.50% |
13.04% |
88.18 |
|
| Skilled Workers, Home Owning Areas |
25.91% |
12.70% |
204.01 |
|
| New Home Owners, Mature Communities |
5.57% |
8.14% |
68.38 |
|
| White Collar Workers, Better-Off Multi Ethnic Areas |
2.03% |
4.02% |
50.45 |
|
| Older People, Less Prosperous Areas |
4.06% |
3.19% |
127.44 |
|
| Council Estate Residents, Better-Off Homes |
12.60% |
11.31% |
111.41 |
|
| Council Estate Residents, High Unemployment |
4.66% |
3.06% |
152.11 |
|
| Council Estate Residents, Greatest Hardship |
2.91% |
2.52% |
115.35 |
|
| People in Multi-Ethnic, Low-Income Areas |
2.28% |
2.10% |
108.44 |
|
| Unclassified |
0.00% |
0.06% |
0.00 |
|
|
 |
 |
 |
| £0-5K |
11.11% |
9.41% |
118.05 |
|
| £5-10K |
17.84% |
16.63% |
107.27 |
|
| £10-15K |
16.97% |
16.58% |
102.35 |
|
| £15-20K |
13.46% |
13.58% |
99.11 |
|
| £20-25K |
10.05% |
10.39% |
96.70 |
|
| £25-30K |
7.37% |
7.77% |
94.84 |
|
| £30-35K |
5.41% |
5.79% |
93.40 |
|
| £35-40K |
4.00% |
4.33% |
92.29 |
|
| £40-45K |
2.99% |
3.27% |
91.45 |
|
| £45-50K |
2.25% |
2.48% |
90.81 |
|
| £50-55K |
1.72% |
1.90% |
90.35 |
|
| £55-60K |
1.33% |
1.47% |
90.02 |
|
| £60-65K |
1.03% |
1.15% |
89.80 |
|
| £65-70K |
0.81% |
0.91% |
89.66 |
|
| £70-75K |
0.64% |
0.72% |
89.60 |
|
| £75-80K |
0.51% |
0.57% |
89.59 |
|
| £80-85K |
0.41% |
0.46% |
89.62 |
|
| £85-90K |
0.34% |
0.37% |
89.69 |
|
| £90-95K |
0.27% |
0.31% |
89.79 |
|
| £95-100K |
0.22% |
0.25% |
89.91 |
|
| £100K + |
1.22% |
1.34% |
91.11 |
|
|
|

|


|
1992-1997
|
1997-2001
|
|
|
|
| Con |
-10.76% |
| Lab |
16.20% |
| LD |
0.01% |
|
| Con |
0.51% |
| Lab |
-0.68% |
| LD |
4.94% |
|
|
 |
Jim Cunningham
Labour hold
|
| Con |
 |
11,846 |
29.56% |
| Lab |
 |
20,125 |
50.21% |
| LD |
 |
5,672 |
14.15% |
| Oth |
 |
2,435 |
6.08% |
| Maj |
 |
8,279 |
20.66% |
| Turn |
 |
40,078 |
53.78% |
|
|
 |
Jim Cunningham
Labour hold
|
| L |
Jim Cunningham |
20,125 |
50.21% |
| SL |
TImothy Logan |
414 |
1.03% |
| LD |
Vincent McKee |
5,672 |
14.15% |
| I |
Irene Rogers |
546 |
1.36% |
| C |
Heather Wheeler |
11,846 |
29.56% |
| SA |
Rob Windsor |
1,475 |
3.68% |
|
Candidates representing 6 parties stood for election to this seat.
|
|
 |
Jim Cunningham
Labour gain
|
| Con |
 |
14,558 |
29.04% |
| Lab |
 |
25,511 |
50.90% |
| LD |
 |
4,617 |
9.21% |
| Ref |
 |
943 |
1.88% |
| Oth |
 |
4,495 |
8.97% |
| Maj |
 |
10,953 |
21.85% |
| Turn |
 |
50,124 |
69.79% |
|
|
 |
|
Conservative
|
| Con |
 |
22,674 |
39.80% |
| Lab |
 |
19,770 |
34.70% |
| LD |
 |
5,260 |
9.20% |
| Oth |
 |
9,229 |
16.20% |
| Maj |
 |
2,904 |
5.10% |
| Turn |
 |
56,933 |
77.38% |
|
|
 |
|

|

