|
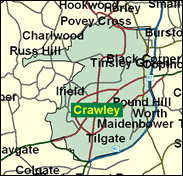
Crawley
Labour hold

For decades Labour could not win a seat in west Sussex, but now Crawley looks very safe; in the May 2000 local elections, even in the midterm of the government when they were at an ebb of popularity they outpolled their Conservative rivals by 20pc in the Borough of Crawley and won 10 of the 12 council wards. This may be affluent southern England, but Crawley is still an ex government designated New Town with about one and a half times as many local authority houses as an average constituency and scarcely less working class than the national average, with by far the largest percentage of ethnic minorities in Sussex (though that isn't saying very much). It also seems much less Euro-phobic than most of the county, indeed than most of England, and a breakdown of its votes in the Euro-elections of June 1999 suggest that even this issue will not play for the Tories here.

One of five new Labour MPs in Sussex in 1997, Laura Moffatt, a former nurse, was born in 1954 and brought up in Crawley, educated at Hazelwick Comprehensive School and Crawley College of Technology. She was selected from an all-women shortlist and detests ‘sexist terminology’. Having oddly opted in the Commons for assignment to the Defence Select Committee, her interests have ranged from the NHS to Nato.
 |
| Wealthy Achievers, Suburban Areas |
7.88% |
14.99% |
52.57 |
|
| Affluent Greys, Rural Communities |
0.00% |
2.13% |
0.00 |
|
| Prosperous Pensioners, Retirement Areas |
0.57% |
2.49% |
22.79 |
|
| Affluent Executives, Family Areas |
11.25% |
4.43% |
254.12 |
|
| Well-Off Workers, Family Areas |
6.19% |
7.27% |
85.14 |
|
| Affluent Urbanites, Town & City Areas |
2.82% |
2.56% |
110.13 |
|
| Prosperous Professionals, Metropolitan Areas |
0.06% |
2.04% |
3.00 |
|
| Better-Off Executives, Inner City Areas |
0.22% |
3.94% |
5.49 |
|
| Comfortable Middle Agers, Mature Home Owning Areas |
9.41% |
13.04% |
72.20 |
|
| Skilled Workers, Home Owning Areas |
11.96% |
12.70% |
94.19 |
|
| New Home Owners, Mature Communities |
13.36% |
8.14% |
164.04 |
|
| White Collar Workers, Better-Off Multi Ethnic Areas |
2.40% |
4.02% |
59.72 |
|
| Older People, Less Prosperous Areas |
7.45% |
3.19% |
233.78 |
|
| Council Estate Residents, Better-Off Homes |
25.18% |
11.31% |
222.61 |
|
| Council Estate Residents, High Unemployment |
0.39% |
3.06% |
12.70 |
|
| Council Estate Residents, Greatest Hardship |
0.36% |
2.52% |
14.31 |
|
| People in Multi-Ethnic, Low-Income Areas |
0.49% |
2.10% |
23.38 |
|
| Unclassified |
0.01% |
0.06% |
11.46 |
|
|
 |
 |
 |
| £0-5K |
8.21% |
9.41% |
87.20 |
|
| £5-10K |
15.19% |
16.63% |
91.36 |
|
| £10-15K |
16.11% |
16.58% |
97.15 |
|
| £15-20K |
13.83% |
13.58% |
101.78 |
|
| £20-25K |
10.92% |
10.39% |
105.10 |
|
| £25-30K |
8.35% |
7.77% |
107.35 |
|
| £30-35K |
6.30% |
5.79% |
108.77 |
|
| £35-40K |
4.75% |
4.33% |
109.54 |
|
| £40-45K |
3.59% |
3.27% |
109.81 |
|
| £45-50K |
2.72% |
2.48% |
109.68 |
|
| £50-55K |
2.08% |
1.90% |
109.25 |
|
| £55-60K |
1.60% |
1.47% |
108.57 |
|
| £60-65K |
1.24% |
1.15% |
107.70 |
|
| £65-70K |
0.97% |
0.91% |
106.68 |
|
| £70-75K |
0.76% |
0.72% |
105.53 |
|
| £75-80K |
0.60% |
0.57% |
104.30 |
|
| £80-85K |
0.48% |
0.46% |
102.99 |
|
| £85-90K |
0.38% |
0.37% |
101.63 |
|
| £90-95K |
0.31% |
0.31% |
100.24 |
|
| £95-100K |
0.25% |
0.25% |
98.82 |
|
| £100K + |
1.19% |
1.34% |
88.89 |
|
|
|

|


|
1992-1997
|
1997-2001
|
|
|
|
| Con |
-12.18% |
| Lab |
14.74% |
| LD |
-6.29% |
|
| Con |
0.36% |
| Lab |
-5.73% |
| LD |
4.46% |
|
|
 |
Laura Moffatt
Labour hold
|
| Con |
 |
12,718 |
32.18% |
| Lab |
 |
19,488 |
49.31% |
| LD |
 |
5,009 |
12.67% |
| Oth |
 |
2,307 |
5.84% |
| Maj |
 |
6,770 |
17.13% |
| Turn |
 |
39,522 |
55.18% |
|
|
 |
Laura Moffatt
Labour hold
|
| UK |
Brian Galloway |
1,137 |
2.88% |
| SA |
Muriel Hirsch |
251 |
0.64% |
| JP |
Arshad Khan |
271 |
0.69% |
| L |
Laura Moffatt |
19,488 |
49.31% |
| LD |
Linda Seekings |
5,009 |
12.67% |
| C |
Henry Smith |
12,718 |
32.18% |
| ML |
Claire Staniford |
388 |
0.98% |
| SL |
Karl Stewart |
260 |
0.66% |
|
Candidates representing 8 parties stood for election to this seat.
|
|
 |
Laura Moffatt
Labour gain
|
| Con |
 |
16,043 |
31.82% |
| Lab |
 |
27,750 |
55.04% |
| LD |
 |
4,141 |
8.21% |
| Ref |
 |
1,931 |
3.83% |
| Oth |
 |
552 |
1.09% |
| Maj |
 |
11,707 |
23.22% |
| Turn |
 |
50,417 |
73.03% |
|
|
 |
|
Conservative
|
| Con |
 |
22,738 |
44.00% |
| Lab |
 |
20,848 |
40.30% |
| LD |
 |
7,492 |
14.50% |
| Oth |
 |
645 |
1.20% |
| Maj |
 |
1,890 |
3.70% |
| Turn |
 |
51,723 |
77.54% |
|
|
 |
|

|

