|
Crewe & Nantwich
Labour hold

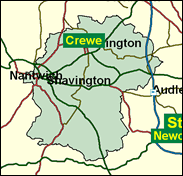
This division now looks like a safe Labour seat, but although it and its predecessors have been in their hands since 1945, they could have been derailed on more than one occasion. Since the pairing of the industrial town of Crewe, known for its junction for trains and its engineering, particularly its manufacture of Rolls Royce cars (not aeroplane engines), with the douce half timbered town of Nantwich, this has been one of the more socially and politically divided towns in England. Crewe is bigger than Nantwich but in 1983 Gwyneth Dunwoody's majority was cut to 290 votes. In 1997 this redoubtable lady stretched her lead to nearly 16,000, but this was mainly due to the national swing rather than the boundary changes which increased suburban at the expense of rural areas from that year. In theory therefore, this could be reversed, which would bring back the seat's marginal status.

Gwynneth Dunwoody, squarely-built and as hard-boiled as a 30 minute egg, was born in 1930 and elected first here in 1974, after 4 years as MP for Exeter in the 1960s. Labour’s longest-running woman MP among the 101 elected in 1997, she is decidedly not one of Blair’s Babes, whom she mocks for their whingeing about sexism and Commons creches. She scorns the ease with which they were dropped into the Commons on all-women shortlists without years of struggle first in hopeless seats. She is the daughter of Morgan Phillips, General Secretary of the Labour Party from 1944 to 1962, one of whose last acts was to launch ‘Signposts For The Sixties’, which promised ‘an integrated transport system.’ She, as Transport Select Committee chairman, and everyone else, is still waiting 40 years on.
 |
| Wealthy Achievers, Suburban Areas |
14.13% |
14.99% |
94.27 |
|
| Affluent Greys, Rural Communities |
0.36% |
2.13% |
17.03 |
|
| Prosperous Pensioners, Retirement Areas |
0.31% |
2.49% |
12.66 |
|
| Affluent Executives, Family Areas |
6.46% |
4.43% |
146.07 |
|
| Well-Off Workers, Family Areas |
6.93% |
7.27% |
95.28 |
|
| Affluent Urbanites, Town & City Areas |
0.24% |
2.56% |
9.45 |
|
| Prosperous Professionals, Metropolitan Areas |
0.00% |
2.04% |
0.00 |
|
| Better-Off Executives, Inner City Areas |
0.23% |
3.94% |
5.87 |
|
| Comfortable Middle Agers, Mature Home Owning Areas |
14.56% |
13.04% |
111.70 |
|
| Skilled Workers, Home Owning Areas |
27.97% |
12.70% |
220.18 |
|
| New Home Owners, Mature Communities |
10.92% |
8.14% |
134.06 |
|
| White Collar Workers, Better-Off Multi Ethnic Areas |
1.27% |
4.02% |
31.69 |
|
| Older People, Less Prosperous Areas |
3.81% |
3.19% |
119.58 |
|
| Council Estate Residents, Better-Off Homes |
8.83% |
11.31% |
78.08 |
|
| Council Estate Residents, High Unemployment |
0.27% |
3.06% |
8.97 |
|
| Council Estate Residents, Greatest Hardship |
3.59% |
2.52% |
142.58 |
|
| People in Multi-Ethnic, Low-Income Areas |
0.00% |
2.10% |
0.00 |
|
| Unclassified |
0.09% |
0.06% |
143.60 |
|
|
 |
 |
 |
| £0-5K |
9.56% |
9.41% |
101.55 |
|
| £5-10K |
18.25% |
16.63% |
109.72 |
|
| £10-15K |
18.14% |
16.58% |
109.42 |
|
| £15-20K |
14.44% |
13.58% |
106.30 |
|
| £20-25K |
10.62% |
10.39% |
102.21 |
|
| £25-30K |
7.61% |
7.77% |
97.95 |
|
| £30-35K |
5.44% |
5.79% |
93.87 |
|
| £35-40K |
3.90% |
4.33% |
90.10 |
|
| £40-45K |
2.83% |
3.27% |
86.68 |
|
| £45-50K |
2.07% |
2.48% |
83.59 |
|
| £50-55K |
1.54% |
1.90% |
80.80 |
|
| £55-60K |
1.15% |
1.47% |
78.28 |
|
| £60-65K |
0.87% |
1.15% |
75.99 |
|
| £65-70K |
0.67% |
0.91% |
73.91 |
|
| £70-75K |
0.52% |
0.72% |
71.99 |
|
| £75-80K |
0.40% |
0.57% |
70.23 |
|
| £80-85K |
0.32% |
0.46% |
68.60 |
|
| £85-90K |
0.25% |
0.37% |
67.08 |
|
| £90-95K |
0.20% |
0.31% |
65.66 |
|
| £95-100K |
0.16% |
0.25% |
64.33 |
|
| £100K + |
0.77% |
1.34% |
57.27 |
|
|
|

|


|
1992-1997
|
1997-2001
|
|
|
|
| Con |
-11.90% |
| Lab |
10.62% |
| LD |
-0.76% |
|
| Con |
3.45% |
| Lab |
-3.93% |
| LD |
1.73% |
|
|
 |
Gwyneth Dunwoody
Labour hold
|
| Con |
 |
12,650 |
30.45% |
| Lab |
 |
22,556 |
54.29% |
| LD |
 |
5,595 |
13.47% |
| Oth |
 |
746 |
1.80% |
| Maj |
 |
9,906 |
23.84% |
| Turn |
 |
41,547 |
60.18% |
|
|
 |
Gwyneth Dunwoody
Labour hold
|
| LD |
David Cannon |
5,595 |
13.47% |
| UK |
Roger Croston |
746 |
1.80% |
| L |
Gwyneth Dunwoody |
22,556 |
54.29% |
| C |
Donald Potter |
12,650 |
30.45% |
|
Candidates representing 4 parties stood for election to this seat.
|
|
 |
Gwyneth Dunwoody
Labour
|
| Con |
 |
13,662 |
27.00% |
| Lab |
 |
29,460 |
58.22% |
| LD |
 |
5,940 |
11.74% |
| Ref |
 |
1,543 |
3.05% |
| Oth |
|
0 |
0.00% |
| Maj |
 |
15,798 |
31.22% |
| Turn |
 |
50,605 |
73.67% |
|
|
 |
|
Labour
|
| Con |
 |
21,751 |
38.90% |
| Lab |
 |
26,622 |
47.60% |
| LD |
 |
6,991 |
12.50% |
| Oth |
 |
579 |
1.00% |
| Maj |
 |
4,871 |
8.70% |
| Turn |
 |
55,943 |
81.90% |
|
|
 |
|

|

