|
Crosby
Labour hold

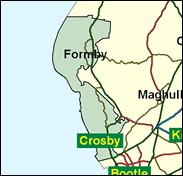
Labour's Claire Curtis-Thomas (then Curtis-Tansley) produced an early-declared massive (18pc) swing and shock by seizing Crosby in the centre of the Merseyside borough of Sefton by over 7,000 in 1997. This had been assumed to be a safe Tory seat so the national TV cameras were not there to capture it as a symbol in the way Gisela Stuart's less spectacular victory at Birmingham Edgbaston was. But a Tory revival is not impossible. They polled the most votes in the borough council elections of May 2000, and retain strong potential in Formby and the Blundellsands area; and they have come back from defeat before, by removing Shirley Williams after her byelection win for the SDP in 1982. It will probably be closer than 7,000 next time, and it would even be foolish to predict in whose favour.

Very tall, Welsh-accented Clare Curtis-Thomas, a Blair’s Babe elected in 1997, quickly took six months off to bond with her own new-born babe. Elected originally as Clare Curtis-Tansley, she adopted her present name after her election, the various options being derived from her mother (Curtis) and two of her former husbands’ names (Tansley and Thomas), but not her current husband’s name, which is ‘Lewis.’ Otherwise she is a rather rare Welsh born (1958) female chartered engineer, with a degree from Cardiff University, who doesn’t rebel, saying: ‘I am in the Centre, extremely rational and reasonable.’
 |
| Wealthy Achievers, Suburban Areas |
41.69% |
14.99% |
278.03 |
|
| Affluent Greys, Rural Communities |
0.00% |
2.13% |
0.00 |
|
| Prosperous Pensioners, Retirement Areas |
1.85% |
2.49% |
74.46 |
|
| Affluent Executives, Family Areas |
1.80% |
4.43% |
40.71 |
|
| Well-Off Workers, Family Areas |
3.49% |
7.27% |
48.05 |
|
| Affluent Urbanites, Town & City Areas |
4.54% |
2.56% |
176.92 |
|
| Prosperous Professionals, Metropolitan Areas |
0.11% |
2.04% |
5.22 |
|
| Better-Off Executives, Inner City Areas |
3.92% |
3.94% |
99.31 |
|
| Comfortable Middle Agers, Mature Home Owning Areas |
20.10% |
13.04% |
154.18 |
|
| Skilled Workers, Home Owning Areas |
4.30% |
12.70% |
33.87 |
|
| New Home Owners, Mature Communities |
2.72% |
8.14% |
33.43 |
|
| White Collar Workers, Better-Off Multi Ethnic Areas |
7.61% |
4.02% |
189.14 |
|
| Older People, Less Prosperous Areas |
0.94% |
3.19% |
29.38 |
|
| Council Estate Residents, Better-Off Homes |
3.16% |
11.31% |
27.95 |
|
| Council Estate Residents, High Unemployment |
2.50% |
3.06% |
81.67 |
|
| Council Estate Residents, Greatest Hardship |
1.25% |
2.52% |
49.73 |
|
| People in Multi-Ethnic, Low-Income Areas |
0.02% |
2.10% |
0.92 |
|
| Unclassified |
0.00% |
0.06% |
0.00 |
|
|
 |
 |
 |
| £0-5K |
7.03% |
9.41% |
74.65 |
|
| £5-10K |
13.51% |
16.63% |
81.20 |
|
| £10-15K |
14.77% |
16.58% |
89.06 |
|
| £15-20K |
13.15% |
13.58% |
96.84 |
|
| £20-25K |
10.80% |
10.39% |
103.96 |
|
| £25-30K |
8.57% |
7.77% |
110.23 |
|
| £30-35K |
6.70% |
5.79% |
115.68 |
|
| £35-40K |
5.21% |
4.33% |
120.35 |
|
| £40-45K |
4.06% |
3.27% |
124.35 |
|
| £45-50K |
3.17% |
2.48% |
127.76 |
|
| £50-55K |
2.49% |
1.90% |
130.67 |
|
| £55-60K |
1.96% |
1.47% |
133.15 |
|
| £60-65K |
1.56% |
1.15% |
135.27 |
|
| £65-70K |
1.24% |
0.91% |
137.06 |
|
| £70-75K |
1.00% |
0.72% |
138.59 |
|
| £75-80K |
0.80% |
0.57% |
139.88 |
|
| £80-85K |
0.65% |
0.46% |
140.97 |
|
| £85-90K |
0.53% |
0.37% |
141.88 |
|
| £90-95K |
0.44% |
0.31% |
142.63 |
|
| £95-100K |
0.36% |
0.25% |
143.25 |
|
| £100K + |
1.93% |
1.34% |
143.60 |
|
|
|

|


|
1992-1997
|
1997-2001
|
|
|
|
| Con |
-13.89% |
| Lab |
22.38% |
| LD |
-8.49% |
|
| Con |
-2.33% |
| Lab |
4.05% |
| LD |
-0.43% |
|
|
 |
Claire Curtis-Thomas
Labour hold
|
| Con |
 |
11,974 |
32.48% |
| Lab |
 |
20,327 |
55.14% |
| LD |
 |
4,084 |
11.08% |
| Oth |
 |
481 |
1.30% |
| Maj |
 |
8,353 |
22.66% |
| Turn |
 |
36,866 |
64.25% |
|
|
 |
Claire Curtis-Thomas
Labour hold
|
| C |
Robert Collinson |
11,974 |
32.48% |
| L |
Claire Curtis-Thomas |
20,327 |
55.14% |
| LD |
Tim Drake |
4,084 |
11.08% |
| SL |
Mark Holt |
481 |
1.30% |
|
Candidates representing 4 parties stood for election to this seat.
|
|
 |
Clare Curtis-Tansley
Labour gain
|
| Con |
 |
15,367 |
34.81% |
| Lab |
 |
22,549 |
51.08% |
| LD |
 |
5,080 |
11.51% |
| Ref |
 |
813 |
1.84% |
| Oth |
 |
332 |
0.75% |
| Maj |
 |
7,182 |
16.27% |
| Turn |
 |
44,141 |
77.18% |
|
|
 |
|
Conservative
|
| Con |
 |
23,329 |
48.70% |
| Lab |
 |
13,738 |
28.70% |
| LD |
 |
9,558 |
20.00% |
| Oth |
 |
1,237 |
2.60% |
| Maj |
 |
9,591 |
20.00% |
| Turn |
 |
47,862 |
81.29% |
|
|
 |
|

|

