|
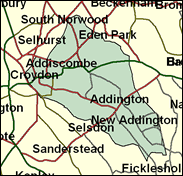
Croydon Central
Labour hold

The Conservatives' seventh best chance of a gain in the critical Greater London region, Croydon Central's fall would betoken a Labour overall majority of under 100. The Conservatives did regain an 8pc lead in the wards which make up this seat in the borough elections of 1998, winning strongly in Monks Orchard, Spring Park and Fairfield and also taking a couple of marginal wards, and they stretched this lead to 11pc in the Euro elections the next year, 1999. Yet they would be expected to do better in midterm elections than in a General; the vast majority of historical evidence suggests so. That it is likely to be a very closely fought contest is further evidence that Mr Blair can expect a comfortable overall majority and a second full term in government.

Geraint Davies, son of a Welsh Office civil servant, born 1960, educated at Llanishen Comprehensive School, Cardiff and Jesus College Oxford, won the seat in 1997, after running Croydon Council for a year, and his own ‘green’ travel company. He is an orthodox loyalist defender of the government’s economic policy, with an earlier private sector background as a marketing manager with Colgate Palmolive and Unilever. David Congdon, who lost here in 1997, stands again for the Conservatives. A former computer systems analyst with Philips Electronics and, since losing his seat, PR man for Mencap, he is an unobtrusive suburban loyaliSt He was born in 1949, educated at Alleyns School, Dulwich and Thames Polytechnic, and was a Croydon councillor for 16 years.
 |
| Wealthy Achievers, Suburban Areas |
13.24% |
14.99% |
88.33 |
|
| Affluent Greys, Rural Communities |
0.00% |
2.13% |
0.00 |
|
| Prosperous Pensioners, Retirement Areas |
0.66% |
2.49% |
26.44 |
|
| Affluent Executives, Family Areas |
1.06% |
4.43% |
24.01 |
|
| Well-Off Workers, Family Areas |
2.34% |
7.27% |
32.22 |
|
| Affluent Urbanites, Town & City Areas |
6.77% |
2.56% |
264.01 |
|
| Prosperous Professionals, Metropolitan Areas |
9.76% |
2.04% |
478.42 |
|
| Better-Off Executives, Inner City Areas |
7.06% |
3.94% |
179.02 |
|
| Comfortable Middle Agers, Mature Home Owning Areas |
8.38% |
13.04% |
64.26 |
|
| Skilled Workers, Home Owning Areas |
15.13% |
12.70% |
119.11 |
|
| New Home Owners, Mature Communities |
4.23% |
8.14% |
51.94 |
|
| White Collar Workers, Better-Off Multi Ethnic Areas |
10.13% |
4.02% |
251.80 |
|
| Older People, Less Prosperous Areas |
1.19% |
3.19% |
37.26 |
|
| Council Estate Residents, Better-Off Homes |
10.05% |
11.31% |
88.82 |
|
| Council Estate Residents, High Unemployment |
3.09% |
3.06% |
100.85 |
|
| Council Estate Residents, Greatest Hardship |
5.70% |
2.52% |
226.22 |
|
| People in Multi-Ethnic, Low-Income Areas |
1.18% |
2.10% |
56.36 |
|
| Unclassified |
0.03% |
0.06% |
47.19 |
|
|
 |
 |
 |
| £0-5K |
6.41% |
9.41% |
68.09 |
|
| £5-10K |
12.41% |
16.63% |
74.61 |
|
| £10-15K |
13.94% |
16.58% |
84.07 |
|
| £15-20K |
12.79% |
13.58% |
94.13 |
|
| £20-25K |
10.79% |
10.39% |
103.81 |
|
| £25-30K |
8.76% |
7.77% |
112.72 |
|
| £30-35K |
6.99% |
5.79% |
120.71 |
|
| £35-40K |
5.54% |
4.33% |
127.76 |
|
| £40-45K |
4.37% |
3.27% |
133.91 |
|
| £45-50K |
3.46% |
2.48% |
139.23 |
|
| £50-55K |
2.74% |
1.90% |
143.81 |
|
| £55-60K |
2.18% |
1.47% |
147.71 |
|
| £60-65K |
1.74% |
1.15% |
151.02 |
|
| £65-70K |
1.39% |
0.91% |
153.82 |
|
| £70-75K |
1.12% |
0.72% |
156.17 |
|
| £75-80K |
0.91% |
0.57% |
158.12 |
|
| £80-85K |
0.74% |
0.46% |
159.73 |
|
| £85-90K |
0.60% |
0.37% |
161.04 |
|
| £90-95K |
0.49% |
0.31% |
162.09 |
|
| £95-100K |
0.41% |
0.25% |
162.91 |
|
| £100K + |
2.19% |
1.34% |
162.81 |
|
|
|

|


|
1992-1997
|
1997-2001
|
|
|
|
| Con |
-16.91% |
| Lab |
14.08% |
| LD |
-2.14% |
|
| Con |
-0.09% |
| Lab |
1.62% |
| LD |
0.38% |
|
|
 |
Geraint Davies
Labour hold
|
| Con |
 |
17,659 |
38.51% |
| Lab |
 |
21,643 |
47.19% |
| LD |
 |
5,156 |
11.24% |
| Oth |
 |
1,402 |
3.06% |
| Maj |
 |
3,984 |
8.69% |
| Turn |
 |
45,860 |
59.12% |
|
|
 |
Geraint Davies
Labour hold
|
| LD |
Paul Booth |
5,156 |
11.24% |
| ML |
John Cartwright |
408 |
0.89% |
| C |
David Congdon |
17,659 |
38.51% |
| L |
Geraint Davies |
21,643 |
47.19% |
| UK |
James Feisenberger |
545 |
1.19% |
| BNP |
Lynda Miller |
449 |
0.98% |
|
Candidates representing 6 parties stood for election to this seat.
|
|
 |
Geraint Davies
Labour gain
|
| Con |
 |
21,535 |
38.59% |
| Lab |
 |
25,432 |
45.58% |
| LD |
 |
6,061 |
10.86% |
| Ref |
 |
1,886 |
3.38% |
| Oth |
 |
885 |
1.59% |
| Maj |
 |
3,897 |
6.98% |
| Turn |
 |
55,799 |
69.62% |
|
|
 |
|
Conservative
|
| Con |
 |
33,940 |
55.50% |
| Lab |
 |
19,279 |
31.50% |
| LD |
 |
7,934 |
13.00% |
| Oth |
|
0 |
0.00% |
| Maj |
 |
14,661 |
24.00% |
| Turn |
 |
61,153 |
74.80% |
|
|
 |
|

|

