|
Arundel & South Downs
Conservative hold

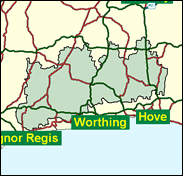
One of the ten safest Conservative seats is to be found here in West Sussex. Arundel is somewhat fortunate to be included in the name of the seat, for its population of 3,000 is one of the smallest of any town so honoured anywhere in Britain. But it does include a mighty castle, the home of the nation's premier Roman Catholic aristocratic family, and a cathedral (heavily associated therewith), and one of the most beautiful first class cricket grounds (ditto) and so fully deserves the mention. Nor are there any other towns of even as many as 10,000 souls. This peaceful, prosperous heartland of the lush southern English countryside is the epitome of the traditional character and virtues of the land, and its political allegiance is undoubting, or certainly unswaying.

Howard Flight, big and breezy and a Treasury spokesman, was elected in 1997. Misleadingly self-described as 'Essex Man', he comes with rather more traditional accoutrements than most of the Romford-born, as a plummy-voiced public school (albeit Brentwood) and Cambridge (Magdalene)-and-Michigan-educated investment manager, whose wife works at Sotheby's. His political pedigree is Right-wing with links to the Freedom Association and the Seldsdon Group, a keen advocate of welfare privatisation and a backer of Redwood in 1997 even into the last ditch with Kenneth Clarke. A defender of capitalism as redolent of a Bach fugue, he prefers its unregulated American to its European version and has opposed the EU's withholding tax. He dismissed Labour's total hand gun ban as 'political correctness'.

 |
| Wealthy Achievers, Suburban Areas |
45.26% |
14.99% |
301.84 |
|
| Affluent Greys, Rural Communities |
2.86% |
2.13% |
134.68 |
|
| Prosperous Pensioners, Retirement Areas |
5.62% |
2.49% |
226.02 |
|
| Affluent Executives, Family Areas |
0.44% |
4.43% |
9.95 |
|
| Well-Off Workers, Family Areas |
7.48% |
7.27% |
102.78 |
|
| Affluent Urbanites, Town & City Areas |
1.05% |
2.56% |
40.88 |
|
| Prosperous Professionals, Metropolitan Areas |
0.41% |
2.04% |
20.11 |
|
| Better-Off Executives, Inner City Areas |
0.00% |
3.94% |
0.00 |
|
| Comfortable Middle Agers, Mature Home Owning Areas |
22.59% |
13.04% |
173.25 |
|
| Skilled Workers, Home Owning Areas |
2.42% |
12.70% |
19.02 |
|
| New Home Owners, Mature Communities |
7.32% |
8.14% |
89.94 |
|
| White Collar Workers, Better-Off Multi Ethnic Areas |
0.18% |
4.02% |
4.42 |
|
| Older People, Less Prosperous Areas |
1.04% |
3.19% |
32.60 |
|
| Council Estate Residents, Better-Off Homes |
2.45% |
11.31% |
21.69 |
|
| Council Estate Residents, High Unemployment |
0.88% |
3.06% |
28.69 |
|
| Council Estate Residents, Greatest Hardship |
0.01% |
2.52% |
0.31 |
|
| People in Multi-Ethnic, Low-Income Areas |
0.00% |
2.10% |
0.00 |
|
| Unclassified |
0.00% |
0.06% |
1.77 |
|
|
 |
 |
 |
| £0-5K |
6.15% |
9.41% |
65.38 |
|
| £5-10K |
11.93% |
16.63% |
71.75 |
|
| £10-15K |
13.57% |
16.58% |
81.83 |
|
| £15-20K |
12.55% |
13.58% |
92.37 |
|
| £20-25K |
10.65% |
10.39% |
102.45 |
|
| £25-30K |
8.69% |
7.77% |
111.76 |
|
| £30-35K |
6.96% |
5.79% |
120.25 |
|
| £35-40K |
5.54% |
4.33% |
127.93 |
|
| £40-45K |
4.40% |
3.27% |
134.89 |
|
| £45-50K |
3.50% |
2.48% |
141.20 |
|
| £50-55K |
2.80% |
1.90% |
146.92 |
|
| £55-60K |
2.24% |
1.47% |
152.14 |
|
| £60-65K |
1.81% |
1.15% |
156.92 |
|
| £65-70K |
1.46% |
0.91% |
161.31 |
|
| £70-75K |
1.19% |
0.72% |
165.35 |
|
| £75-80K |
0.97% |
0.57% |
169.10 |
|
| £80-85K |
0.80% |
0.46% |
172.58 |
|
| £85-90K |
0.66% |
0.37% |
175.83 |
|
| £90-95K |
0.55% |
0.31% |
178.86 |
|
| £95-100K |
0.45% |
0.25% |
181.70 |
|
| £100K + |
2.64% |
1.34% |
196.30 |
|
|
|

|


|
1992-1997
|
1997-2001
|
|
|
|
| Con |
-9.72% |
| Lab |
8.96% |
| LD |
0.64% |
|
| Con |
-0.85% |
| Lab |
2.41% |
| LD |
-3.37% |
|
|
 |
Howard Flight
Conservative hold
|
| Con |
 |
23,969 |
52.23% |
| Lab |
 |
9,488 |
20.68% |
| LD |
 |
10,265 |
22.37% |
| Oth |
 |
2,167 |
4.72% |
| Maj |
 |
13,704 |
29.86% |
| Turn |
 |
45,889 |
64.67% |
|
|
 |
Howard Flight
Conservative hold
|
| LD |
Derek Deedman |
10,265 |
22.37% |
| C |
Howard Flight |
23,969 |
52.23% |
| UK |
Robert Perin |
2,167 |
4.72% |
| L |
Charles Taylor |
9,488 |
20.68% |
|
Candidates representing 4 parties stood for election to this seat.
|
|
 |
Howard Flight
Conservative
|
| Con |
 |
27,251 |
53.08% |
| Lab |
 |
9,376 |
18.26% |
| LD |
 |
13,216 |
25.74% |
| Ref |
|
0 |
0.00% |
| Oth |
 |
1,494 |
2.91% |
| Maj |
 |
14,035 |
27.34% |
| Turn |
 |
51,337 |
75.90% |
|
|
 |
|
Conservative
|
| Con |
 |
33,365 |
62.80% |
| Lab |
 |
4,957 |
9.30% |
| LD |
 |
13,349 |
25.10% |
| Oth |
 |
1,464 |
2.80% |
| Maj |
 |
20,016 |
37.70% |
| Turn |
 |
53,135 |
81.68% |
|
|
 |
|

|

