|
Croydon North
Labour hold

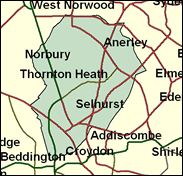
Although Croydon, in outer south London, used to be thought of as one of the more Conservative boroughs as well as the biggest, with its major "downtown" office centre and tower blocks reminiscent of an American city betokening a prosperity verging on a boom. But there is another side to Croydon too. In the north, towards London, elements of the inner city are influential, with terraced housing and a non-white resident percentage of over 30pc. Labour wins wards like Thornton Heath, Bensham Manor, and Broad Green easily and are competitive with the Tories in Norbury and the Norwood wards. Malcolm Wicks benefited from a swing of nearly 18pc in 1997 and won with a thumping majority of over 18,000.

Malcolm Wicks, an Education minister since 1999, is a former family policy specialist who delayed his arrival in government by saying for too long that benefits were a right of citizenship and not solely for the poor. Popular with women for his strong defence of the Child Support Agency, but not with the Serbs whose every action in the Balkans he has excoriated, he was born 1947, educated at Elizabeth College, Guernsey (fee paying), North West London Polytechnic, LSE and York University. After academic posts he ran the Family Policy Studies Centre for nine years. As an Education minister he sardonically accepts, in his party’s populist way, that apprenticeship courses for 16 year olds may not lead straight to the Cambridge Footlights.
 |
| Wealthy Achievers, Suburban Areas |
3.77% |
14.99% |
25.15 |
|
| Affluent Greys, Rural Communities |
0.00% |
2.13% |
0.00 |
|
| Prosperous Pensioners, Retirement Areas |
0.50% |
2.49% |
20.24 |
|
| Affluent Executives, Family Areas |
0.00% |
4.43% |
0.00 |
|
| Well-Off Workers, Family Areas |
0.20% |
7.27% |
2.74 |
|
| Affluent Urbanites, Town & City Areas |
4.44% |
2.56% |
173.29 |
|
| Prosperous Professionals, Metropolitan Areas |
10.13% |
2.04% |
496.32 |
|
| Better-Off Executives, Inner City Areas |
6.62% |
3.94% |
167.89 |
|
| Comfortable Middle Agers, Mature Home Owning Areas |
2.46% |
13.04% |
18.84 |
|
| Skilled Workers, Home Owning Areas |
2.62% |
12.70% |
20.63 |
|
| New Home Owners, Mature Communities |
0.10% |
8.14% |
1.22 |
|
| White Collar Workers, Better-Off Multi Ethnic Areas |
57.98% |
4.02% |
1,441.63 |
|
| Older People, Less Prosperous Areas |
0.08% |
3.19% |
2.37 |
|
| Council Estate Residents, Better-Off Homes |
4.09% |
11.31% |
36.17 |
|
| Council Estate Residents, High Unemployment |
4.93% |
3.06% |
160.85 |
|
| Council Estate Residents, Greatest Hardship |
0.32% |
2.52% |
12.78 |
|
| People in Multi-Ethnic, Low-Income Areas |
1.76% |
2.10% |
83.97 |
|
| Unclassified |
0.00% |
0.06% |
0.00 |
|
|
 |
 |
 |
| £0-5K |
7.01% |
9.41% |
74.44 |
|
| £5-10K |
13.35% |
16.63% |
80.26 |
|
| £10-15K |
14.78% |
16.58% |
89.17 |
|
| £15-20K |
13.28% |
13.58% |
97.75 |
|
| £20-25K |
10.94% |
10.39% |
105.23 |
|
| £25-30K |
8.67% |
7.77% |
111.51 |
|
| £30-35K |
6.76% |
5.79% |
116.70 |
|
| £35-40K |
5.24% |
4.33% |
120.97 |
|
| £40-45K |
4.06% |
3.27% |
124.47 |
|
| £45-50K |
3.16% |
2.48% |
127.34 |
|
| £50-55K |
2.47% |
1.90% |
129.70 |
|
| £55-60K |
1.94% |
1.47% |
131.65 |
|
| £60-65K |
1.53% |
1.15% |
133.26 |
|
| £65-70K |
1.22% |
0.91% |
134.59 |
|
| £70-75K |
0.98% |
0.72% |
135.70 |
|
| £75-80K |
0.79% |
0.57% |
136.63 |
|
| £80-85K |
0.64% |
0.46% |
137.40 |
|
| £85-90K |
0.52% |
0.37% |
138.05 |
|
| £90-95K |
0.42% |
0.31% |
138.58 |
|
| £95-100K |
0.35% |
0.25% |
139.03 |
|
| £100K + |
1.88% |
1.34% |
140.02 |
|
|
|

|


|
1992-1997
|
1997-2001
|
|
|
|
| Con |
-17.54% |
| Lab |
17.76% |
| LD |
-3.16% |
|
| Con |
-3.87% |
| Lab |
1.38% |
| LD |
2.71% |
|
|
 |
Malcolm Wicks
Labour hold
|
| Con |
 |
9,752 |
23.28% |
| Lab |
 |
26,610 |
63.54% |
| LD |
 |
4,375 |
10.45% |
| Oth |
 |
1,145 |
2.73% |
| Maj |
 |
16,858 |
40.25% |
| Turn |
 |
41,882 |
54.68% |
|
|
 |
Malcolm Wicks
Labour hold
|
| C |
Simon Allison |
9,752 |
23.28% |
| LD |
Sandra Lawman |
4,375 |
10.45% |
| SA |
Don Madgwick |
539 |
1.29% |
| UK |
Alan Smith |
606 |
1.45% |
| L |
Malcolm Wicks |
26,610 |
63.54% |
|
Candidates representing 5 parties stood for election to this seat.
|
|
 |
Malcolm Wicks
Labour gain
|
| Con |
 |
14,274 |
27.16% |
| Lab |
 |
32,672 |
62.16% |
| LD |
 |
4,066 |
7.74% |
| Ref |
 |
1,155 |
2.20% |
| Oth |
 |
396 |
0.75% |
| Maj |
 |
18,398 |
35.00% |
| Turn |
 |
52,563 |
68.21% |
|
|
 |
|
Conservative
|
| Con |
 |
25,865 |
44.70% |
| Lab |
 |
25,705 |
44.40% |
| LD |
 |
6,340 |
10.90% |
| Oth |
|
0 |
0.00% |
| Maj |
 |
160 |
0.30% |
| Turn |
 |
57,910 |
72.32% |
|
|
 |
|

|

