|
Croydon South
Conservative hold

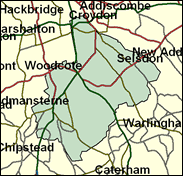
The Tories' second safest seat in the whole of Greater London is on its very fringes, and looks and behaves much more like Surrey, which it borders, a county which entirely resisted the New Labour landslide in 1997. With over three quarters of its workers in non-manual jobs, this is the tenth most middle class seat in Britain. Here are to be found the classic suburbs of Purley, Coulsdon, Sanderstead and Selsdon, the site of a conference which brought about the temporary shift to the right in the economic policy of the Heath government which led to the coining of the phrase "Selsdon Man", which itself sounds prehistoric now. We may come to a situation in which a Conservative government of any hue requires the achievement of a feat of memory, but if so, Croydon South will still be loyally Tory.

Richard Ottaway, a slight, compact and puckish solicitor and former oil trader, was elected here in 1992, after 4 years at Nottingham North from 1983 to 1987. A Treasury spokesman (as Shadow Paymaster General) and a frontbencher since 1995, he was PPS to Michael Heseltine and voted for Ken Clarke in 1997, credentials unlikely to endear him to most of his current colleagues. Born 1945, son of a Bristol academic, after serving in the Navy for 9 years he studied law at Bristol University. He led for the Tories on London government after 1997, accepting a Mayor but not an Assembly. He campaigns on abortion and world population control. He is quiet on Europe because he comes from the Positive Europe Group.
 |
| Wealthy Achievers, Suburban Areas |
46.19% |
14.99% |
308.09 |
|
| Affluent Greys, Rural Communities |
0.00% |
2.13% |
0.00 |
|
| Prosperous Pensioners, Retirement Areas |
1.12% |
2.49% |
44.99 |
|
| Affluent Executives, Family Areas |
0.66% |
4.43% |
14.89 |
|
| Well-Off Workers, Family Areas |
6.12% |
7.27% |
84.13 |
|
| Affluent Urbanites, Town & City Areas |
7.00% |
2.56% |
272.94 |
|
| Prosperous Professionals, Metropolitan Areas |
8.16% |
2.04% |
399.56 |
|
| Better-Off Executives, Inner City Areas |
1.33% |
3.94% |
33.73 |
|
| Comfortable Middle Agers, Mature Home Owning Areas |
10.75% |
13.04% |
82.44 |
|
| Skilled Workers, Home Owning Areas |
7.78% |
12.70% |
61.28 |
|
| New Home Owners, Mature Communities |
3.90% |
8.14% |
47.87 |
|
| White Collar Workers, Better-Off Multi Ethnic Areas |
2.38% |
4.02% |
59.26 |
|
| Older People, Less Prosperous Areas |
0.54% |
3.19% |
17.04 |
|
| Council Estate Residents, Better-Off Homes |
2.01% |
11.31% |
17.76 |
|
| Council Estate Residents, High Unemployment |
1.71% |
3.06% |
55.94 |
|
| Council Estate Residents, Greatest Hardship |
0.35% |
2.52% |
13.74 |
|
| People in Multi-Ethnic, Low-Income Areas |
0.00% |
2.10% |
0.00 |
|
| Unclassified |
0.00% |
0.06% |
0.00 |
|
|
 |
 |
 |
| £0-5K |
4.27% |
9.41% |
45.38 |
|
| £5-10K |
8.62% |
16.63% |
51.80 |
|
| £10-15K |
10.83% |
16.58% |
65.33 |
|
| £15-20K |
11.09% |
13.58% |
81.63 |
|
| £20-25K |
10.30% |
10.39% |
99.07 |
|
| £25-30K |
9.07% |
7.77% |
116.69 |
|
| £30-35K |
7.76% |
5.79% |
133.89 |
|
| £35-40K |
6.51% |
4.33% |
150.29 |
|
| £40-45K |
5.41% |
3.27% |
165.67 |
|
| £45-50K |
4.47% |
2.48% |
179.93 |
|
| £50-55K |
3.68% |
1.90% |
193.03 |
|
| £55-60K |
3.02% |
1.47% |
204.98 |
|
| £60-65K |
2.48% |
1.15% |
215.82 |
|
| £65-70K |
2.05% |
0.91% |
225.62 |
|
| £70-75K |
1.69% |
0.72% |
234.44 |
|
| £75-80K |
1.39% |
0.57% |
242.36 |
|
| £80-85K |
1.15% |
0.46% |
249.44 |
|
| £85-90K |
0.96% |
0.37% |
255.75 |
|
| £90-95K |
0.80% |
0.31% |
261.38 |
|
| £95-100K |
0.67% |
0.25% |
266.36 |
|
| £100K + |
3.80% |
1.34% |
282.70 |
|
|
|

|


|
1992-1997
|
1997-2001
|
|
|
|
| Con |
-14.38% |
| Lab |
9.01% |
| LD |
-0.49% |
|
| Con |
1.88% |
| Lab |
4.59% |
| LD |
-2.85% |
|
|
 |
Richard Ottaway
Conservative hold
|
| Con |
 |
22,169 |
49.20% |
| Lab |
 |
13,472 |
29.90% |
| LD |
 |
8,226 |
18.26% |
| Oth |
 |
1,193 |
2.65% |
| Maj |
 |
8,697 |
19.30% |
| Turn |
 |
45,060 |
61.39% |
|
|
 |
Richard Ottaway
Conservative hold
|
| LD |
Anne Gallop |
8,226 |
18.26% |
| UK |
Kathleen Garner |
998 |
2.21% |
| C |
Richard Ottaway |
22,169 |
49.20% |
| L |
Gerry Ryan |
13,472 |
29.90% |
| CH |
Mark Samuel |
195 |
0.43% |
|
Candidates representing 5 parties stood for election to this seat.
|
|
 |
Richard Ottaway
Conservative
|
| Con |
 |
25,649 |
47.32% |
| Lab |
 |
13,719 |
25.31% |
| LD |
 |
11,441 |
21.11% |
| Ref |
 |
2,631 |
4.85% |
| Oth |
 |
759 |
1.40% |
| Maj |
 |
11,930 |
22.01% |
| Turn |
 |
54,199 |
73.45% |
|
|
 |
|
Conservative
|
| Con |
 |
35,937 |
61.70% |
| Lab |
 |
9,513 |
16.30% |
| LD |
 |
12,599 |
21.60% |
| Oth |
 |
242 |
0.40% |
| Maj |
 |
23,338 |
40.00% |
| Turn |
 |
58,291 |
77.95% |
|
|
 |
|

|

