|
Cunninghame North
Labour hold

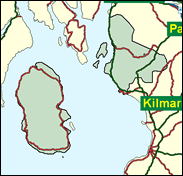
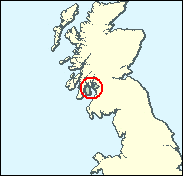
A Tory seat until 1987, Cunninghame North (formerly North Ayrshire and Bute) still has some picturesque reminders of non-industrial Scotland. It includes some islands: the large Arran, and the smaller Cumbraes in the firth of Clyde; and the largely Conservative seaside resort of Largs. But the other coastal towns are industrial, Saltcoats and Ardrossan, and the Garnock valley inland is an old mining area centred on Beith, Dalry and Kilbirnie. The SNP are second in all these, as they were in the 1999 Scottish Parliament seat here, and the new order has been established in Cunninghame North: Labour first, the SNP second, the Conservatives third.

Former journalist Brian Wilson, MP here since 1987, born 1948, educated at Dunoon Grammar School and Dundee University, is an anti-devolutionist and abrasive hammer of the SNP, factors which have blocked his advance into the Cabinet as Scottish Secretary. A perennial minister of state, he currently resides, following the reshuffle in the wake of the second going of Peter Mandelson, at the Foreign Office. With his political rise originally based on a romantic assault on Scottish lairds, his name in opposition was made on rail privatisation, where he displayed an off-message keenness for renationalisation. His unionist hostility to devolution led him to describe BBC TV’s Newsnight Scottish opt-out as ‘drivel’ and a ‘Mickey Mouse operation,’ a slur unlikely to endear him to the hugely pro-devolution Scottish media pack.
 |
| Wealthy Achievers, Suburban Areas |
12.21% |
14.99% |
81.45 |
|
| Affluent Greys, Rural Communities |
8.83% |
2.13% |
415.17 |
|
| Prosperous Pensioners, Retirement Areas |
5.06% |
2.49% |
203.62 |
|
| Affluent Executives, Family Areas |
2.85% |
4.43% |
64.34 |
|
| Well-Off Workers, Family Areas |
8.84% |
7.27% |
121.59 |
|
| Affluent Urbanites, Town & City Areas |
1.42% |
2.56% |
55.40 |
|
| Prosperous Professionals, Metropolitan Areas |
0.44% |
2.04% |
21.52 |
|
| Better-Off Executives, Inner City Areas |
2.45% |
3.94% |
62.13 |
|
| Comfortable Middle Agers, Mature Home Owning Areas |
5.34% |
13.04% |
40.97 |
|
| Skilled Workers, Home Owning Areas |
3.71% |
12.70% |
29.21 |
|
| New Home Owners, Mature Communities |
6.65% |
8.14% |
81.65 |
|
| White Collar Workers, Better-Off Multi Ethnic Areas |
0.51% |
4.02% |
12.56 |
|
| Older People, Less Prosperous Areas |
6.39% |
3.19% |
200.51 |
|
| Council Estate Residents, Better-Off Homes |
17.82% |
11.31% |
157.53 |
|
| Council Estate Residents, High Unemployment |
7.62% |
3.06% |
248.97 |
|
| Council Estate Residents, Greatest Hardship |
9.86% |
2.52% |
391.50 |
|
| People in Multi-Ethnic, Low-Income Areas |
0.00% |
2.10% |
0.00 |
|
| Unclassified |
0.00% |
0.06% |
0.00 |
|
|
 |
 |
 |
| £0-5K |
11.30% |
9.41% |
119.99 |
|
| £5-10K |
18.29% |
16.63% |
109.94 |
|
| £10-15K |
17.22% |
16.58% |
103.89 |
|
| £15-20K |
13.56% |
13.58% |
99.86 |
|
| £20-25K |
10.08% |
10.39% |
96.98 |
|
| £25-30K |
7.37% |
7.77% |
94.78 |
|
| £30-35K |
5.38% |
5.79% |
92.97 |
|
| £35-40K |
3.96% |
4.33% |
91.36 |
|
| £40-45K |
2.93% |
3.27% |
89.87 |
|
| £45-50K |
2.19% |
2.48% |
88.42 |
|
| £50-55K |
1.66% |
1.90% |
86.98 |
|
| £55-60K |
1.26% |
1.47% |
85.55 |
|
| £60-65K |
0.97% |
1.15% |
84.11 |
|
| £65-70K |
0.75% |
0.91% |
82.66 |
|
| £70-75K |
0.58% |
0.72% |
81.21 |
|
| £75-80K |
0.46% |
0.57% |
79.76 |
|
| £80-85K |
0.36% |
0.46% |
78.31 |
|
| £85-90K |
0.29% |
0.37% |
76.88 |
|
| £90-95K |
0.23% |
0.31% |
75.46 |
|
| £95-100K |
0.19% |
0.25% |
74.06 |
|
| £100K + |
0.88% |
1.34% |
65.28 |
|
|
|

|


|
1992-1997
|
1997-2001
|
|
|
|
| Con |
-10.64% |
| Lab |
9.30% |
| LD |
-1.18% |
| SNP |
0.24% |
|
| Con |
-3.74% |
| Lab |
-4.25% |
| LD |
3.53% |
| SNP |
2.77% |
|
|
 |
Brian Wilson
Labour hold
|
| Con |
 |
6,666 |
19.71% |
| Lab |
 |
15,571 |
46.05% |
| LD |
 |
3,060 |
9.05% |
| SNP |
 |
7,173 |
21.21% |
| Oth |
 |
1,346 |
3.98% |
| Maj |
 |
8,398 |
24.83% |
| Turn |
 |
33,816 |
61.49% |
|
|
 |
Brian Wilson
Labour hold
|
| LD |
Ross Chmiel |
3,060 |
9.05% |
| SNP |
Campbell Martin |
7,173 |
21.21% |
| SL |
Louise McDaid |
382 |
1.13% |
| SSP |
Sean Scott |
964 |
2.85% |
| C |
Richard Wilkinson |
6,666 |
19.71% |
| L |
Brian Wilson |
15,571 |
46.05% |
|
Candidates representing 6 parties stood for election to this seat.
|
|
 |
Brian Wilson
Labour
|
| Con |
 |
9,647 |
23.46% |
| Lab |
 |
20,686 |
50.30% |
| LD |
 |
2,271 |
5.52% |
| SNP |
 |
7,584 |
18.44% |
| Ref |
 |
440 |
1.07% |
| Oth |
 |
501 |
1.22% |
| Maj |
 |
11,039 |
26.84% |
| Turn |
 |
41,129 |
74.07% |
|
|
 |
|
Labour
|
| Con |
 |
14,625 |
34.10% |
| Lab |
 |
17,564 |
41.00% |
| LD |
 |
2,864 |
6.70% |
| SNP |
 |
7,813 |
18.20% |
| Oth |
|
0 |
0.00% |
| Maj |
 |
2,939 |
6.90% |
| Turn |
 |
42,866 |
77.25% |
|
|
 |
|

|

