|
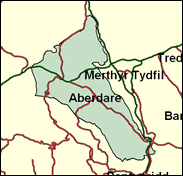
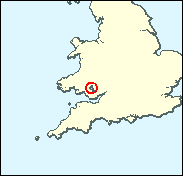
Cynon Valley
Labour hold

Labour held on to Cynon Valley (which includes Aberdare and Mountain Ash) by less than 1,000 votes in the May 1999 Welsh Assembly elections. This may well be a high-water mark for Plaid Cymru in a set of elections whose circumstances favoured them - a Welsh focus; an apparent attempt by Labour's HQ in England to foist a leader on the Welsh party; a midterm date; and a low turnout. As with other valley seats producing deviant results (from the mainstream of South Welsh history, anyway) a return to the norm is likely in 2001.

Ann Clwyd, a blonde fringed former journalist dropped by Blair from the frontbench in 1995 for going AWOL amongst the Kurds, was destined for the chop anyway as an awkward squaddie, a vituperative third world human rights campaigner and simply too old. Born 1937 and educated at Queen’s School Chester and Bangor University, she as a North Welsh woman was parachuted into the boyo culture of South Wales, and was never on easy terms with the Whip Ray Powell, who secured her sacking. So under the Blair government she has been a woman-for-(nearly)-all-rebellions, on lone parent benefit cuts, Murdoch’s predatory pricing, freedom of information, means testing of disability benefits, jury trial curbs, linking pensions to average earnings, and air traffic control privatisation.
 |
| Wealthy Achievers, Suburban Areas |
1.71% |
14.99% |
11.38 |
|
| Affluent Greys, Rural Communities |
0.19% |
2.13% |
8.72 |
|
| Prosperous Pensioners, Retirement Areas |
0.32% |
2.49% |
12.81 |
|
| Affluent Executives, Family Areas |
1.64% |
4.43% |
37.06 |
|
| Well-Off Workers, Family Areas |
5.02% |
7.27% |
68.95 |
|
| Affluent Urbanites, Town & City Areas |
0.00% |
2.56% |
0.00 |
|
| Prosperous Professionals, Metropolitan Areas |
0.00% |
2.04% |
0.00 |
|
| Better-Off Executives, Inner City Areas |
0.00% |
3.94% |
0.00 |
|
| Comfortable Middle Agers, Mature Home Owning Areas |
5.26% |
13.04% |
40.33 |
|
| Skilled Workers, Home Owning Areas |
52.82% |
12.70% |
415.82 |
|
| New Home Owners, Mature Communities |
12.93% |
8.14% |
158.74 |
|
| White Collar Workers, Better-Off Multi Ethnic Areas |
0.04% |
4.02% |
1.00 |
|
| Older People, Less Prosperous Areas |
5.52% |
3.19% |
173.21 |
|
| Council Estate Residents, Better-Off Homes |
8.89% |
11.31% |
78.61 |
|
| Council Estate Residents, High Unemployment |
0.69% |
3.06% |
22.65 |
|
| Council Estate Residents, Greatest Hardship |
4.99% |
2.52% |
198.01 |
|
| People in Multi-Ethnic, Low-Income Areas |
0.00% |
2.10% |
0.00 |
|
| Unclassified |
0.00% |
0.06% |
0.00 |
|
|
 |
|
|
| £0-5K |
13.72% |
9.41% |
145.70 |
|
| £5-10K |
22.65% |
16.63% |
136.19 |
|
| £10-15K |
19.93% |
16.58% |
120.23 |
|
| £15-20K |
14.25% |
13.58% |
104.92 |
|
| £20-25K |
9.54% |
10.39% |
91.75 |
|
| £25-30K |
6.28% |
7.77% |
80.79 |
|
| £30-35K |
4.15% |
5.79% |
71.71 |
|
| £35-40K |
2.78% |
4.33% |
64.17 |
|
| £40-45K |
1.89% |
3.27% |
57.86 |
|
| £45-50K |
1.30% |
2.48% |
52.54 |
|
| £50-55K |
0.91% |
1.90% |
48.02 |
|
| £55-60K |
0.65% |
1.47% |
44.13 |
|
| £60-65K |
0.47% |
1.15% |
40.77 |
|
| £65-70K |
0.34% |
0.91% |
37.85 |
|
| £70-75K |
0.25% |
0.72% |
35.28 |
|
| £75-80K |
0.19% |
0.57% |
33.01 |
|
| £80-85K |
0.14% |
0.46% |
30.99 |
|
| £85-90K |
0.11% |
0.37% |
29.19 |
|
| £90-95K |
0.08% |
0.31% |
27.57 |
|
| £95-100K |
0.07% |
0.25% |
26.10 |
|
| £100K + |
0.26% |
1.34% |
19.69 |
|
|
|
|


|
1992-1997
|
1997-2001
|
|
|
|
| Con |
-6.13% |
| Lab |
0.63% |
| LD |
3.35% |
| PC |
-0.37% |
|
| Con |
0.82% |
| Lab |
-4.13% |
| LD |
-0.92% |
| PC |
6.76% |
|
|
|
Ann Clwyd
Labour hold
|
| Con |
 |
2,045 |
7.59% |
| Lab |
 |
17,685 |
65.60% |
| LD |
 |
2,541 |
9.43% |
| PC |
 |
4,687 |
17.39% |
| Oth |
|
0 |
0.00% |
| Maj |
 |
12,998 |
48.22% |
| Turn |
|
26,958 |
48590.48% |
|
|
|
Ann Clwyd
Labour hold
|
| L |
Ann Clwyd |
17,685 |
65.60% |
| PC |
Steven Cornelius |
4,687 |
17.39% |
| LD |
Ian Parry |
2,541 |
9.43% |
| C |
Julian Waters |
2,045 |
7.59% |
|
Candidates representing 4 parties stood for election to this seat.
|
|
|
Ann Clwyd
Labour
|
| Con |
|
2,262 |
6.77% |
| Lab |
|
23,307 |
69.73% |
| LD |
|
3,459 |
10.35% |
| PC |
|
3,552 |
10.63% |
| Ref |
 |
844 |
2.53% |
| Oth |
|
0 |
0.00% |
| Maj |
|
19,755 |
59.10% |
| Turn |
|
33,424 |
69.22% |
|
|
|
|
Labour
|
| Con |
|
4,890 |
12.90% |
| Lab |
|
26,254 |
69.10% |
| LD |
|
2,667 |
7.00% |
| PC |
|
4,186 |
11.00% |
| Oth |
|
0 |
0.00% |
| Maj |
|
21,364 |
56.20% |
| Turn |
|
37,997 |
75.95% |
|
|
|
|
|