|
Dagenham
Labour hold

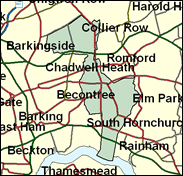
Judith Church, proclaiming dissatisfaction with life at Westminster, announced her retirement after serving just two half-terms in the Commons. Elected at a by-election in 1994, re-elected 1997, she revealed in 1999 that she would not stand again. Her successor in the safe Labour Dagenham seat in the outer East End of London is a party insider, Jon Cruddas, who seems unlikely to be disillusioned so swiftly. Dagenham was effectively created in one decade, the 1920s, when the huge Becontree council estate, the largest single planned public housing development in British history was constructed, its population rising from 2,00 in 1922 to 103,000 in 1932. The seat is majority owner occupied now, but the rigid geometric shapes are still apparent on an A to Z street map or in a personal visit, creating an impression of a uniform and even oppressive working class environment. Yet Dagenham has produced individuals with talents as varied as those of Dudley Moore and Terry Venables, an intriguing conjunction. Its politics have been fairly monochrome Labour, but there was a large aberrant swing towards Thatcherism in the 1980s which reduced the former member Bryan Gould (there is a tradition of cerebral MPs here) to a majority of under 2,500. This was a far cry from the 31,735 achieved by John Parker, later Father of the House, in 1950, or even from the 17,000 bequeathed by Judith Church.

Jon Cruddas has replaced the disillusioned Judith Church, previously a rising star on Labour's NEC, who is quitting after only six and a half as MP. Cruddas is one of a clutch of top insiders coming in as replacements in safe seats. Formerly a Downing Street adviser as Deputy Political Secretary to the Prime Minister, and before 1997 for three years Chief Assistant to Labour Party General Secretary Tom Sawyer, he was born 1962 and educated at Oaklands RC Comprehensive School, Portsmouth and at Warwick University, where he acquired a PhD. His wife is also an apparatchik, currently as adviser to Transport Minister Lord (Gus) MacDonald.
 |
| Wealthy Achievers, Suburban Areas |
0.00% |
14.99% |
0.00 |
|
| Affluent Greys, Rural Communities |
0.00% |
2.13% |
0.00 |
|
| Prosperous Pensioners, Retirement Areas |
0.05% |
2.49% |
1.94 |
|
| Affluent Executives, Family Areas |
0.00% |
4.43% |
0.00 |
|
| Well-Off Workers, Family Areas |
0.12% |
7.27% |
1.60 |
|
| Affluent Urbanites, Town & City Areas |
0.88% |
2.56% |
34.44 |
|
| Prosperous Professionals, Metropolitan Areas |
0.00% |
2.04% |
0.00 |
|
| Better-Off Executives, Inner City Areas |
0.11% |
3.94% |
2.83 |
|
| Comfortable Middle Agers, Mature Home Owning Areas |
3.48% |
13.04% |
26.66 |
|
| Skilled Workers, Home Owning Areas |
28.87% |
12.70% |
227.31 |
|
| New Home Owners, Mature Communities |
10.93% |
8.14% |
134.19 |
|
| White Collar Workers, Better-Off Multi Ethnic Areas |
0.67% |
4.02% |
16.66 |
|
| Older People, Less Prosperous Areas |
5.41% |
3.19% |
169.98 |
|
| Council Estate Residents, Better-Off Homes |
43.07% |
11.31% |
380.79 |
|
| Council Estate Residents, High Unemployment |
4.08% |
3.06% |
133.17 |
|
| Council Estate Residents, Greatest Hardship |
2.20% |
2.52% |
87.21 |
|
| People in Multi-Ethnic, Low-Income Areas |
0.13% |
2.10% |
6.37 |
|
| Unclassified |
0.00% |
0.06% |
0.00 |
|
|
 |
 |
 |
| £0-5K |
11.40% |
9.41% |
121.06 |
|
| £5-10K |
18.06% |
16.63% |
108.57 |
|
| £10-15K |
17.32% |
16.58% |
104.47 |
|
| £15-20K |
13.83% |
13.58% |
101.84 |
|
| £20-25K |
10.33% |
10.39% |
99.37 |
|
| £25-30K |
7.52% |
7.77% |
96.78 |
|
| £30-35K |
5.45% |
5.79% |
94.09 |
|
| £35-40K |
3.96% |
4.33% |
91.34 |
|
| £40-45K |
2.89% |
3.27% |
88.61 |
|
| £45-50K |
2.13% |
2.48% |
85.95 |
|
| £50-55K |
1.59% |
1.90% |
83.39 |
|
| £55-60K |
1.19% |
1.47% |
80.94 |
|
| £60-65K |
0.91% |
1.15% |
78.62 |
|
| £65-70K |
0.69% |
0.91% |
76.43 |
|
| £70-75K |
0.53% |
0.72% |
74.37 |
|
| £75-80K |
0.42% |
0.57% |
72.43 |
|
| £80-85K |
0.33% |
0.46% |
70.61 |
|
| £85-90K |
0.26% |
0.37% |
68.91 |
|
| £90-95K |
0.21% |
0.31% |
67.31 |
|
| £95-100K |
0.16% |
0.25% |
65.81 |
|
| £100K + |
0.78% |
1.34% |
58.16 |
|
|
|

|


|
1992-1997
|
1997-2001
|
|
|
|
| Con |
-18.36% |
| Lab |
14.00% |
| LD |
-4.02% |
|
| Con |
7.17% |
| Lab |
-8.47% |
| LD |
2.75% |
|
|
 |
Jon Cruddas
Labour hold
|
| Con |
 |
7,091 |
25.71% |
| Lab |
 |
15,784 |
57.23% |
| LD |
 |
2,820 |
10.22% |
| Oth |
 |
1,885 |
6.83% |
| Maj |
 |
8,693 |
31.52% |
| Turn |
 |
27,580 |
46.48% |
|
|
 |
Jon Cruddas
Labour hold
|
| L |
Jon Cruddas |
15,784 |
57.23% |
| LD |
Adrian Gee-Turner |
2,820 |
10.22% |
| SA |
Berlyne Hamilton |
262 |
0.95% |
| BNP |
David Hill |
1,378 |
5.00% |
| SL |
Robert Siggins |
245 |
0.89% |
| C |
Michael White |
7,091 |
25.71% |
|
Candidates representing 6 parties stood for election to this seat.
|
|
 |
Judith Church
Labour
|
| Con |
 |
6,705 |
18.54% |
| Lab |
 |
23,759 |
65.70% |
| LD |
 |
2,704 |
7.48% |
| Ref |
 |
1,411 |
3.90% |
| Oth |
 |
1,584 |
4.38% |
| Maj |
 |
17,054 |
47.16% |
| Turn |
 |
36,163 |
61.74% |
|
|
 |
|
Labour
|
| Con |
 |
16,052 |
36.90% |
| Lab |
 |
22,499 |
51.70% |
| LD |
 |
4,992 |
11.50% |
| Oth |
|
0 |
0.00% |
| Maj |
 |
6,447 |
14.80% |
| Turn |
 |
43,543 |
69.79% |
|
|
 |
|

|

