|
Darlington
Labour hold

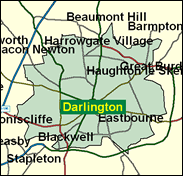
The MP may well put Darlington firmly on the political map. He is Alan Milburn, perhaps the fastest rising of Cabinet members, holding the high-profile and vital Health portfolio, and from the point of view of early in the year 2001 a reasonable bet as a long-term successor to his fellow Durham representative Tony Blair as party leader and even PM. Darlington has never been a rock solid Labour seat. It was held by Michael Fallon for the Conservatives from 1983 to 1992, and it is not just an industrial town known in history as the central station on the world's first passenger railway line, from Shildon to Stockton (1825) but as a major market centre even for folk from the North Yorkshire Dales, with attractive residential areas in the west of the town, less than 20pc council tenants and overall half and half working and middle class. Take away the 14pc swing Milburn and his party achieved in 1997 and one is left with a majority of only just over 5pc, or about 2,500. That would be a very diffferent matter for the fast rising Mr Milburn to chew on.

Pinched-faced and abrasive with a strangulated Geordie accent to rival the more affected tones of Jack Cunningham, Alan Milburn is the effortlessly-rising Blairite. Son of a single mother, he was born 1958, educated at Stokesley Comprehensive School and Lancaster University and rose via jobs for unions and local authorities before winning this seat from the Tories in 1992. Currently Health Secretary, he has spent all his time in government either at Health or in the Treasury, so he probably knows better than anyone the truth about NHS spending under a Labour government, as the customers struggle to work it out.
 |
| Wealthy Achievers, Suburban Areas |
12.50% |
14.99% |
83.40 |
|
| Affluent Greys, Rural Communities |
0.00% |
2.13% |
0.00 |
|
| Prosperous Pensioners, Retirement Areas |
0.69% |
2.49% |
27.60 |
|
| Affluent Executives, Family Areas |
1.87% |
4.43% |
42.30 |
|
| Well-Off Workers, Family Areas |
7.10% |
7.27% |
97.56 |
|
| Affluent Urbanites, Town & City Areas |
3.02% |
2.56% |
117.78 |
|
| Prosperous Professionals, Metropolitan Areas |
0.04% |
2.04% |
2.09 |
|
| Better-Off Executives, Inner City Areas |
2.94% |
3.94% |
74.54 |
|
| Comfortable Middle Agers, Mature Home Owning Areas |
7.42% |
13.04% |
56.90 |
|
| Skilled Workers, Home Owning Areas |
35.36% |
12.70% |
278.37 |
|
| New Home Owners, Mature Communities |
6.83% |
8.14% |
83.86 |
|
| White Collar Workers, Better-Off Multi Ethnic Areas |
1.64% |
4.02% |
40.90 |
|
| Older People, Less Prosperous Areas |
3.78% |
3.19% |
118.56 |
|
| Council Estate Residents, Better-Off Homes |
8.58% |
11.31% |
75.85 |
|
| Council Estate Residents, High Unemployment |
2.11% |
3.06% |
69.03 |
|
| Council Estate Residents, Greatest Hardship |
6.12% |
2.52% |
242.86 |
|
| People in Multi-Ethnic, Low-Income Areas |
0.00% |
2.10% |
0.00 |
|
| Unclassified |
0.00% |
0.06% |
0.00 |
|
|
 |
 |
 |
| £0-5K |
10.95% |
9.41% |
116.31 |
|
| £5-10K |
19.55% |
16.63% |
117.53 |
|
| £10-15K |
18.55% |
16.58% |
111.86 |
|
| £15-20K |
14.20% |
13.58% |
104.54 |
|
| £20-25K |
10.13% |
10.39% |
97.49 |
|
| £25-30K |
7.10% |
7.77% |
91.32 |
|
| £30-35K |
4.99% |
5.79% |
86.14 |
|
| £35-40K |
3.55% |
4.33% |
81.86 |
|
| £40-45K |
2.56% |
3.27% |
78.35 |
|
| £45-50K |
1.87% |
2.48% |
75.47 |
|
| £50-55K |
1.39% |
1.90% |
73.11 |
|
| £55-60K |
1.05% |
1.47% |
71.18 |
|
| £60-65K |
0.80% |
1.15% |
69.58 |
|
| £65-70K |
0.62% |
0.91% |
68.27 |
|
| £70-75K |
0.48% |
0.72% |
67.18 |
|
| £75-80K |
0.38% |
0.57% |
66.28 |
|
| £80-85K |
0.30% |
0.46% |
65.53 |
|
| £85-90K |
0.24% |
0.37% |
64.92 |
|
| £90-95K |
0.20% |
0.31% |
64.40 |
|
| £95-100K |
0.16% |
0.25% |
63.98 |
|
| £100K + |
0.85% |
1.34% |
62.95 |
|
|
|

|


|
1992-1997
|
1997-2001
|
|
|
|
| Con |
-14.70% |
| Lab |
13.47% |
| LD |
-1.07% |
|
| Con |
3.48% |
| Lab |
-6.41% |
| LD |
3.46% |
|
|
 |
Alan Milburn
Labour hold
|
| Con |
 |
12,950 |
31.78% |
| Lab |
 |
22,479 |
55.16% |
| LD |
 |
4,358 |
10.69% |
| Oth |
 |
967 |
2.37% |
| Maj |
 |
9,529 |
23.38% |
| Turn |
 |
40,754 |
63.35% |
|
|
 |
Alan Milburn
Labour hold
|
| LD |
Robert Adamson |
4,358 |
10.69% |
| SA |
Alan Docherty |
469 |
1.15% |
| L |
Alan Milburn |
22,479 |
55.16% |
| I |
Craig Platt |
269 |
0.66% |
| C |
Tony Richmond |
12,950 |
31.78% |
| SL |
Amanda Rose |
229 |
0.56% |
|
Candidates representing 6 parties stood for election to this seat.
|
|
 |
Alan Milburn
Labour
|
| Con |
 |
13,633 |
28.30% |
| Lab |
 |
29,658 |
61.57% |
| LD |
 |
3,483 |
7.23% |
| Ref |
 |
1,399 |
2.90% |
| Oth |
|
0 |
0.00% |
| Maj |
 |
16,025 |
33.27% |
| Turn |
 |
48,173 |
73.95% |
|
|
 |
|
Labour
|
| Con |
 |
23,758 |
43.00% |
| Lab |
 |
26,556 |
48.10% |
| LD |
 |
4,586 |
8.30% |
| Oth |
 |
355 |
0.60% |
| Maj |
 |
2,798 |
5.10% |
| Turn |
 |
55,255 |
82.62% |
|
|
 |
|

|

