|
Daventry
Conservative hold

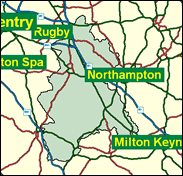
The only Tory seat in Northamptonshire to survive the Blairite surge in 1997, although three others were lost by tiny majorities (see Kettering, Northampton South and Wellingborough), this south Northamptonshire division has always been regarded as by far their best bet in the East Midlands county. It offered a refuge for the right-wing Labour Cabinet minister Reg Prentice, who defected all the way to the Conservatives in protest against the left wingers infiltrating his own constituency party in Newham, east London, in the late 1970s - no bothering with centrists or Liberals in his case. He remained a quiet Tory MP here until his retirement in 1987. This is still safe for his successor Tim Boswell. It is the most extensive and rural seat in the county, and although Daventry itself expanded rapidly in the 1960s and 1970s, most of the population is still in the small towns (Brackley, Towcester) and villages. The British Grand Prix motor racing track at Silverstone, which secured continued rights to hold the annual event in that most money spinning of sports recently, is largely in the seat (it spills over the county boundary into Buckinghamshire). The Conservatives are certain to win the race here in Daventry constituency, even if they lose out in the championship battle, as it were, next time.

Bucolic and chubby-faced farmer’s son Tim Boswell, Conservative spokesman for the disabled, is a One Nation Tory with a local 480-acre farm with, he claims, a BSE-free herd, and a background in the Conservative Research Department and as a Maff adviser. Born 1942, educated at Marlborough and New College Oxford, he stood aside as a prominent Daventry Tory to let Reg Prentice have the seat for eight years before inheriting it himself in 1987. A Clarke campaigner in 1997 and a long-time Europhile he would obviously rise under a Clarke leadership. He votes with a small Tory minority in favour of 16 as the homosexual age of consent.
 |
| Wealthy Achievers, Suburban Areas |
37.63% |
14.99% |
250.99 |
|
| Affluent Greys, Rural Communities |
0.43% |
2.13% |
20.10 |
|
| Prosperous Pensioners, Retirement Areas |
0.21% |
2.49% |
8.26 |
|
| Affluent Executives, Family Areas |
10.07% |
4.43% |
227.49 |
|
| Well-Off Workers, Family Areas |
14.46% |
7.27% |
198.79 |
|
| Affluent Urbanites, Town & City Areas |
0.08% |
2.56% |
3.18 |
|
| Prosperous Professionals, Metropolitan Areas |
0.00% |
2.04% |
0.00 |
|
| Better-Off Executives, Inner City Areas |
0.06% |
3.94% |
1.47 |
|
| Comfortable Middle Agers, Mature Home Owning Areas |
13.94% |
13.04% |
106.93 |
|
| Skilled Workers, Home Owning Areas |
7.40% |
12.70% |
58.29 |
|
| New Home Owners, Mature Communities |
5.48% |
8.14% |
67.33 |
|
| White Collar Workers, Better-Off Multi Ethnic Areas |
1.27% |
4.02% |
31.70 |
|
| Older People, Less Prosperous Areas |
1.51% |
3.19% |
47.40 |
|
| Council Estate Residents, Better-Off Homes |
7.10% |
11.31% |
62.76 |
|
| Council Estate Residents, High Unemployment |
0.00% |
3.06% |
0.00 |
|
| Council Estate Residents, Greatest Hardship |
0.33% |
2.52% |
12.92 |
|
| People in Multi-Ethnic, Low-Income Areas |
0.00% |
2.10% |
0.00 |
|
| Unclassified |
0.03% |
0.06% |
50.66 |
|
|
 |
 |
 |
| £0-5K |
5.50% |
9.41% |
58.43 |
|
| £5-10K |
11.81% |
16.63% |
70.99 |
|
| £10-15K |
13.89% |
16.58% |
83.79 |
|
| £15-20K |
12.95% |
13.58% |
95.33 |
|
| £20-25K |
10.97% |
10.39% |
105.51 |
|
| £25-30K |
8.90% |
7.77% |
114.46 |
|
| £30-35K |
7.08% |
5.79% |
122.32 |
|
| £35-40K |
5.60% |
4.33% |
129.20 |
|
| £40-45K |
4.42% |
3.27% |
135.25 |
|
| £45-50K |
3.49% |
2.48% |
140.58 |
|
| £50-55K |
2.77% |
1.90% |
145.28 |
|
| £55-60K |
2.20% |
1.47% |
149.46 |
|
| £60-65K |
1.76% |
1.15% |
153.18 |
|
| £65-70K |
1.42% |
0.91% |
156.52 |
|
| £70-75K |
1.15% |
0.72% |
159.54 |
|
| £75-80K |
0.93% |
0.57% |
162.28 |
|
| £80-85K |
0.76% |
0.46% |
164.77 |
|
| £85-90K |
0.63% |
0.37% |
167.05 |
|
| £90-95K |
0.52% |
0.31% |
169.16 |
|
| £95-100K |
0.43% |
0.25% |
171.11 |
|
| £100K + |
2.43% |
1.34% |
180.95 |
|
|
|

|


|
1992-1997
|
1997-2001
|
|
|
|
| Con |
-11.46% |
| Lab |
10.49% |
| LD |
-2.65% |
|
| Con |
2.90% |
| Lab |
-2.17% |
| LD |
1.15% |
|
|
 |
Tim Boswell
Conservative hold
|
| Con |
 |
27,911 |
49.24% |
| Lab |
 |
18,262 |
32.22% |
| LD |
 |
9,130 |
16.11% |
| Oth |
 |
1,381 |
2.44% |
| Maj |
 |
9,649 |
17.02% |
| Turn |
 |
56,684 |
65.50% |
|
|
 |
Tim Boswell
Conservative hold
|
| UK |
Peter Baden |
1,381 |
2.44% |
| C |
Tim Boswell |
27,911 |
49.24% |
| LD |
Jamie Calder |
9,130 |
16.11% |
| L |
Kevin Quigley |
18,262 |
32.22% |
|
Candidates representing 4 parties stood for election to this seat.
|
|
 |
Timothy Boswell
Conservative
|
| Con |
 |
28,615 |
46.34% |
| Lab |
 |
21,237 |
34.39% |
| LD |
 |
9,233 |
14.95% |
| Ref |
 |
2,018 |
3.27% |
| Oth |
 |
647 |
1.05% |
| Maj |
 |
7,378 |
11.95% |
| Turn |
 |
61,750 |
77.04% |
|
|
 |
|
Conservative
|
| Con |
 |
35,842 |
57.80% |
| Lab |
 |
14,831 |
23.90% |
| LD |
 |
10,933 |
17.60% |
| Oth |
 |
422 |
0.70% |
| Maj |
 |
21,011 |
33.90% |
| Turn |
 |
62,028 |
82.54% |
|
|
 |
|

|

