|
Ashfield
Labour hold

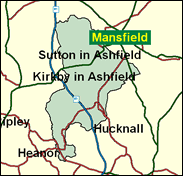
Defence Secretary Geoff Hoon's constituency is a swathe of mid-west Nottinghamshire which used to be heavily associated with both the coal and textile industries, but which has now diversified. There have been a couple of moves to the right in the past which can be explained by curious circumstances: the 1977 by-election when David Marquand resigned to join his spiritual ally Roy Jenkins in the European bureaucracy in Brussels; and the creation of the moderate Union of Democratic Mineworkers (UDM) in response to Arthur Scargill's declaration of a national miners's strike without a ballot in 1984. However, more usually, there has been a Labour majority of 20,000 or so, which is what Hoon enjoyed in 1997, and will probably enjoy next time too.

Defence Minister Geoff Hoon, a clever Europhile barrister and former MEP, is one of Tony Blair’s effortlessly rising technocrats. An orthodox, impassive career politician par excellence, he has conformed with fellow modernisers Darling, Mandelson and Byers in the removal of all facial hair - in his case a moustache. Born 1953 and educated at Nottingham High School and Jesus College, Cambridge, elected MP in 1992, he has risen quickly in government under the patronage of Tony Blair’s mentor, the Lord Irvine - ambitious lawyers all.

 |
| Wealthy Achievers, Suburban Areas |
4.64% |
14.99% |
30.96 |
|
| Affluent Greys, Rural Communities |
0.04% |
2.13% |
1.69 |
|
| Prosperous Pensioners, Retirement Areas |
0.03% |
2.49% |
1.28 |
|
| Affluent Executives, Family Areas |
1.27% |
4.43% |
28.78 |
|
| Well-Off Workers, Family Areas |
3.49% |
7.27% |
48.02 |
|
| Affluent Urbanites, Town & City Areas |
0.00% |
2.56% |
0.00 |
|
| Prosperous Professionals, Metropolitan Areas |
0.00% |
2.04% |
0.00 |
|
| Better-Off Executives, Inner City Areas |
0.00% |
3.94% |
0.00 |
|
| Comfortable Middle Agers, Mature Home Owning Areas |
12.85% |
13.04% |
98.58 |
|
| Skilled Workers, Home Owning Areas |
43.90% |
12.70% |
345.63 |
|
| New Home Owners, Mature Communities |
20.71% |
8.14% |
254.29 |
|
| White Collar Workers, Better-Off Multi Ethnic Areas |
0.00% |
4.02% |
0.00 |
|
| Older People, Less Prosperous Areas |
2.51% |
3.19% |
78.86 |
|
| Council Estate Residents, Better-Off Homes |
8.31% |
11.31% |
73.47 |
|
| Council Estate Residents, High Unemployment |
1.26% |
3.06% |
41.00 |
|
| Council Estate Residents, Greatest Hardship |
0.98% |
2.52% |
38.94 |
|
| People in Multi-Ethnic, Low-Income Areas |
0.00% |
2.10% |
0.00 |
|
| Unclassified |
0.00% |
0.06% |
0.00 |
|
|
 |
 |
 |
| £0-5K |
13.66% |
9.41% |
145.15 |
|
| £5-10K |
22.51% |
16.63% |
135.32 |
|
| £10-15K |
19.93% |
16.58% |
120.23 |
|
| £15-20K |
14.33% |
13.58% |
105.47 |
|
| £20-25K |
9.61% |
10.39% |
92.42 |
|
| £25-30K |
6.32% |
7.77% |
81.30 |
|
| £30-35K |
4.17% |
5.79% |
71.94 |
|
| £35-40K |
2.78% |
4.33% |
64.08 |
|
| £40-45K |
1.88% |
3.27% |
57.46 |
|
| £45-50K |
1.29% |
2.48% |
51.86 |
|
| £50-55K |
0.90% |
1.90% |
47.10 |
|
| £55-60K |
0.63% |
1.47% |
43.02 |
|
| £60-65K |
0.45% |
1.15% |
39.51 |
|
| £65-70K |
0.33% |
0.91% |
36.46 |
|
| £70-75K |
0.24% |
0.72% |
33.79 |
|
| £75-80K |
0.18% |
0.57% |
31.45 |
|
| £80-85K |
0.14% |
0.46% |
29.38 |
|
| £85-90K |
0.10% |
0.37% |
27.53 |
|
| £90-95K |
0.08% |
0.31% |
25.89 |
|
| £95-100K |
0.06% |
0.25% |
24.41 |
|
| £100K + |
0.24% |
1.34% |
18.10 |
|
|
|

|


|
1992-1997
|
1997-2001
|
|
|
|
| Con |
-12.34% |
| Lab |
10.27% |
| LD |
-2.85% |
|
| Con |
4.16% |
| Lab |
-7.04% |
| LD |
1.61% |
|
|
 |
Geoff Hoon
Labour hold
|
| Con |
 |
9,607 |
24.41% |
| Lab |
 |
22,875 |
58.13% |
| LD |
 |
4,428 |
11.25% |
| Oth |
 |
2,440 |
6.20% |
| Maj |
 |
13,268 |
33.72% |
| Turn |
 |
39,350 |
53.59% |
|
|
 |
Geoff Hoon
Labour hold
|
| I |
Melvin Harby |
1,471 |
3.74% |
| L |
Geoff Hoon |
22,875 |
58.13% |
| SL |
Katrina Howse |
380 |
0.97% |
| C |
Julian Leigh |
9,607 |
24.41% |
| LD |
Bill Smith |
4,428 |
11.25% |
| SA |
George Watson |
589 |
1.50% |
|
Candidates representing 6 parties stood for election to this seat.
|
|
 |
Geoff Hoon
Labour
|
| Con |
 |
10,251 |
20.26% |
| Lab |
 |
32,979 |
65.17% |
| LD |
 |
4,882 |
9.65% |
| Ref |
 |
1,896 |
3.75% |
| Oth |
 |
595 |
1.18% |
| Maj |
 |
22,728 |
44.91% |
| Turn |
 |
50,603 |
70.02% |
|
|
 |
|
Labour
|
| Con |
 |
19,015 |
32.60% |
| Lab |
 |
31,978 |
54.90% |
| LD |
 |
7,285 |
12.50% |
| Oth |
|
0 |
0.00% |
| Maj |
 |
12,963 |
22.20% |
| Turn |
 |
58,278 |
79.53% |
|
|
 |
|

|

