|
Delyn
Labour hold

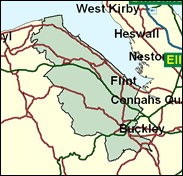
Delyn is a safe Labour seat on the north eastern edge of Wales, far from the Plaid Cymru Welsh speaking heartland. It includes Flint, which some might think sounds like a county town, and Mold, which was in fact the administrative headquarters of Clwyd until its abolition, and Holywell, and the rual hinterland which includes a number of villages among the scenic Clwydian hills. Over 80pc of the population here cannot speak Welsh, and the Conservatives retained second place ahead of Plaid Cymru in , but they only got half as many votes as the Labour winner, the former senior policewoman Alison Halford who was involved in a prominent case concerning internal victimisation and prejudice in the Merseyside force. Her new career has begun brightly.

David Hanson won this seat for Labour in 1992. Son of a fork-lift truck driver, he was born in Liverpool in 1957, attended Verdin Comprehensive School, Winsford, and Hull University, is a former worker for the Spastics Society and Re-Solv, and campaigns on disability issues and on solvent abuse. A loyalist, he was swiftly promoted in government via the Whips Office, to the down-sized post-devolution Welsh Office where, in a two-man band, he is the one who represents the Merseyside end of the Principality. His wife narrowly lost the 1999 Eddisbury byelection.
 |
| Wealthy Achievers, Suburban Areas |
23.19% |
14.99% |
154.70 |
|
| Affluent Greys, Rural Communities |
0.73% |
2.13% |
34.46 |
|
| Prosperous Pensioners, Retirement Areas |
0.58% |
2.49% |
23.49 |
|
| Affluent Executives, Family Areas |
3.71% |
4.43% |
83.77 |
|
| Well-Off Workers, Family Areas |
16.19% |
7.27% |
222.65 |
|
| Affluent Urbanites, Town & City Areas |
0.00% |
2.56% |
0.00 |
|
| Prosperous Professionals, Metropolitan Areas |
0.00% |
2.04% |
0.00 |
|
| Better-Off Executives, Inner City Areas |
0.00% |
3.94% |
0.00 |
|
| Comfortable Middle Agers, Mature Home Owning Areas |
15.97% |
13.04% |
122.46 |
|
| Skilled Workers, Home Owning Areas |
12.64% |
12.70% |
99.49 |
|
| New Home Owners, Mature Communities |
11.96% |
8.14% |
146.85 |
|
| White Collar Workers, Better-Off Multi Ethnic Areas |
0.02% |
4.02% |
0.50 |
|
| Older People, Less Prosperous Areas |
3.21% |
3.19% |
100.69 |
|
| Council Estate Residents, Better-Off Homes |
10.17% |
11.31% |
89.96 |
|
| Council Estate Residents, High Unemployment |
1.07% |
3.06% |
35.01 |
|
| Council Estate Residents, Greatest Hardship |
0.55% |
2.52% |
21.82 |
|
| People in Multi-Ethnic, Low-Income Areas |
0.00% |
2.10% |
0.00 |
|
| Unclassified |
0.00% |
0.06% |
0.00 |
|
|
 |
 |
 |
| £0-5K |
9.67% |
9.41% |
102.76 |
|
| £5-10K |
17.21% |
16.63% |
103.44 |
|
| £10-15K |
17.24% |
16.58% |
104.00 |
|
| £15-20K |
14.12% |
13.58% |
103.97 |
|
| £20-25K |
10.72% |
10.39% |
103.16 |
|
| £25-30K |
7.91% |
7.77% |
101.68 |
|
| £30-35K |
5.78% |
5.79% |
99.72 |
|
| £35-40K |
4.22% |
4.33% |
97.44 |
|
| £40-45K |
3.10% |
3.27% |
94.99 |
|
| £45-50K |
2.30% |
2.48% |
92.48 |
|
| £50-55K |
1.71% |
1.90% |
89.97 |
|
| £55-60K |
1.29% |
1.47% |
87.51 |
|
| £60-65K |
0.98% |
1.15% |
85.14 |
|
| £65-70K |
0.75% |
0.91% |
82.86 |
|
| £70-75K |
0.58% |
0.72% |
80.70 |
|
| £75-80K |
0.45% |
0.57% |
78.64 |
|
| £80-85K |
0.35% |
0.46% |
76.70 |
|
| £85-90K |
0.28% |
0.37% |
74.87 |
|
| £90-95K |
0.22% |
0.31% |
73.13 |
|
| £95-100K |
0.18% |
0.25% |
71.50 |
|
| £100K + |
0.85% |
1.34% |
63.02 |
|
|
|

|


|
1992-1997
|
1997-2001
|
|
|
|
| Con |
-12.91% |
| Lab |
9.21% |
| LD |
-0.53% |
| PC |
1.42% |
|
| Con |
-0.07% |
| Lab |
-4.65% |
| LD |
4.92% |
| PC |
2.61% |
|
|
 |
David Hanson
Labour hold
|
| Con |
 |
9,220 |
26.62% |
| Lab |
 |
17,825 |
51.46% |
| LD |
 |
5,329 |
15.39% |
| PC |
 |
2,262 |
6.53% |
| Oth |
|
0 |
0.00% |
| Maj |
 |
8,605 |
24.84% |
| Turn |
 |
34,636 |
63.28% |
|
|
 |
David Hanson
Labour hold
|
| C |
Paul Brierley |
9,220 |
26.62% |
| L |
David Hanson |
17,825 |
51.46% |
| LD |
Tudor Jones |
5,329 |
15.39% |
| PC |
Paul Rowlinson |
2,262 |
6.53% |
|
Candidates representing 4 parties stood for election to this seat.
|
|
 |
David Hanson
Labour
|
| Con |
 |
10,607 |
26.69% |
| Lab |
 |
22,300 |
56.11% |
| LD |
 |
4,160 |
10.47% |
| PC |
 |
1,558 |
3.92% |
| Ref |
 |
1,117 |
2.81% |
| Oth |
|
0 |
0.00% |
| Maj |
 |
11,693 |
29.42% |
| Turn |
 |
39,742 |
74.02% |
|
|
 |
|
Labour
|
| Con |
 |
17,428 |
39.60% |
| Lab |
 |
20,606 |
46.90% |
| LD |
 |
4,822 |
11.00% |
| PC |
 |
1,116 |
2.50% |
| Oth |
|
0 |
0.00% |
| Maj |
 |
3,178 |
7.20% |
| Turn |
 |
43,972 |
80.37% |
|
|
 |
|

|

