|
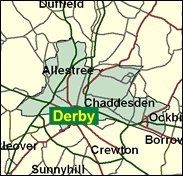
Derby North
Labour hold

In theory a potential Conservative gain in Derbyshire, Derby North should be watched carefully, as local election results from Derby unitary authority in 1999 and 2000 were very close overall in the wards making up the seat. However, the turnout, especially in Labour strongholds like Abbey (14.8pc, May 2000) and Derwent (17.6pc) were very low, and if this is even modestly boosted Bob Laxton must be favourite to secure a second victory in a seat which has been Tory more often than not in the last three decades.

Bob Laxton came to the Commons in 1997 from Labour’s depleted proletarian wing, Derby-born in 1944 and schooled at Allestree Woodlands Secondary Modern and at technical college and working as a telephones engineer for 36 years. On Derby Council for 18 years, he led it for three. A loyalist, if bearing one of the PLP’s 43 (as at 1997) beards, he is the complete local-boy made good with his job being to protect Derby’s Rolls Royce and train-making factories.
 |
| Wealthy Achievers, Suburban Areas |
9.19% |
14.99% |
61.30 |
|
| Affluent Greys, Rural Communities |
0.00% |
2.13% |
0.00 |
|
| Prosperous Pensioners, Retirement Areas |
3.05% |
2.49% |
122.64 |
|
| Affluent Executives, Family Areas |
12.39% |
4.43% |
280.05 |
|
| Well-Off Workers, Family Areas |
6.20% |
7.27% |
85.26 |
|
| Affluent Urbanites, Town & City Areas |
1.02% |
2.56% |
39.87 |
|
| Prosperous Professionals, Metropolitan Areas |
0.15% |
2.04% |
7.14 |
|
| Better-Off Executives, Inner City Areas |
3.11% |
3.94% |
78.78 |
|
| Comfortable Middle Agers, Mature Home Owning Areas |
10.65% |
13.04% |
81.68 |
|
| Skilled Workers, Home Owning Areas |
18.73% |
12.70% |
147.41 |
|
| New Home Owners, Mature Communities |
15.49% |
8.14% |
190.20 |
|
| White Collar Workers, Better-Off Multi Ethnic Areas |
4.49% |
4.02% |
111.60 |
|
| Older People, Less Prosperous Areas |
4.72% |
3.19% |
148.12 |
|
| Council Estate Residents, Better-Off Homes |
8.18% |
11.31% |
72.32 |
|
| Council Estate Residents, High Unemployment |
1.95% |
3.06% |
63.69 |
|
| Council Estate Residents, Greatest Hardship |
0.69% |
2.52% |
27.39 |
|
| People in Multi-Ethnic, Low-Income Areas |
0.00% |
2.10% |
0.00 |
|
| Unclassified |
0.00% |
0.06% |
0.00 |
|
|
 |
 |
 |
| £0-5K |
11.39% |
9.41% |
120.98 |
|
| £5-10K |
19.10% |
16.63% |
114.85 |
|
| £10-15K |
17.96% |
16.58% |
108.33 |
|
| £15-20K |
13.95% |
13.58% |
102.70 |
|
| £20-25K |
10.18% |
10.39% |
97.94 |
|
| £25-30K |
7.29% |
7.77% |
93.80 |
|
| £30-35K |
5.22% |
5.79% |
90.09 |
|
| £35-40K |
3.76% |
4.33% |
86.68 |
|
| £40-45K |
2.73% |
3.27% |
83.48 |
|
| £45-50K |
2.00% |
2.48% |
80.45 |
|
| £50-55K |
1.48% |
1.90% |
77.56 |
|
| £55-60K |
1.10% |
1.47% |
74.79 |
|
| £60-65K |
0.83% |
1.15% |
72.14 |
|
| £65-70K |
0.63% |
0.91% |
69.61 |
|
| £70-75K |
0.48% |
0.72% |
67.19 |
|
| £75-80K |
0.37% |
0.57% |
64.87 |
|
| £80-85K |
0.29% |
0.46% |
62.66 |
|
| £85-90K |
0.23% |
0.37% |
60.55 |
|
| £90-95K |
0.18% |
0.31% |
58.54 |
|
| £95-100K |
0.14% |
0.25% |
56.63 |
|
| £100K + |
0.62% |
1.34% |
46.44 |
|
|
|

|


|
1992-1997
|
1997-2001
|
|
|
|
| Con |
-14.15% |
| Lab |
12.26% |
| LD |
-0.59% |
|
| Con |
0.78% |
| Lab |
-2.28% |
| LD |
5.08% |
|
|
 |
Bob Laxton
Labour hold
|
| Con |
 |
15,433 |
35.03% |
| Lab |
 |
22,415 |
50.88% |
| LD |
 |
6,206 |
14.09% |
| Oth |
|
0 |
0.00% |
| Maj |
 |
6,982 |
15.85% |
| Turn |
 |
44,054 |
57.60% |
|
|
 |
Bob Laxton
Labour hold
|
| LD |
Robert Charlesworth |
6,206 |
14.09% |
| C |
Barrie Holden |
15,433 |
35.03% |
| L |
Bob Laxton |
22,415 |
50.88% |
|
Candidates representing 3 parties stood for election to this seat.
|
|
 |
Bob Laxton
Labour gain
|
| Con |
 |
19,229 |
34.25% |
| Lab |
 |
29,844 |
53.16% |
| LD |
 |
5,059 |
9.01% |
| Ref |
 |
1,816 |
3.23% |
| Oth |
 |
195 |
0.35% |
| Maj |
 |
10,615 |
18.91% |
| Turn |
 |
56,143 |
73.76% |
|
|
 |
|
Conservative
|
| Con |
 |
28,574 |
48.40% |
| Lab |
 |
24,121 |
40.90% |
| LD |
 |
5,638 |
9.60% |
| Oth |
 |
686 |
1.20% |
| Maj |
 |
4,453 |
7.50% |
| Turn |
 |
59,019 |
80.41% |
|
|
 |
|

|

