|
Derby South
Labour hold

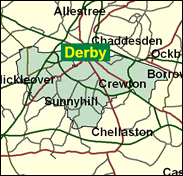
The more strongly Labour half of Derby, and indeed the seat which has remained in their hands since the war, South's social profile looks fairly similar to that of North with the exception of ethnic makeup; there are nearly nine times as many non-white residents here, in the inner sections of the seat like Litchurch and Babington wards, both won by Asian Muslim candidates in the most recent elections in May 2000. There are also mainly white working class Labour strongholds like Normanton, Osmaston and Sinfin nearer the edge of the city. The other wards, which are more middle class (Littleover, Mickleover, Kingsway on the western periphery) were taken by Liberal Democrats, not Tories, then; but this is of less concern to sitting member Margaret Beckett, for the Lib Dems were third in the last General Election, although they did improve their percentage noticeably from a very low base. Ms Beckett will be free to continue leading the House of Commons after the next election should Mr Blair still be in office - and still call on her.

Margaret Beckett, MP here since 1983 (and before that for Lincoln 1974-79) is Labour’s longest running female frontbencher, with all but two of her 26 years in the Commons spent as a spokesman, whip or minister. A professional politician, who has weaved amid the party’s left wing factions, and been out of step with Blair on Clause 4, the minimum wage and union workplace recognition, she was nevertheless the Shadow Chief Secretary before 1992 who prefigured the tight-money regime of Chancellor Brown after 1997. Born 1943 and educated at Catholic schools, she trained as a metallurgist at Manchester College of Science & Technology. Although she is Labour’s senior woman figure, she lacks the charisma and warmth to make her a Barbara Castle, and her dour rather prune-like image alongside Blair on the Treasury bench conveys the impression of less than unconditional support.
 |
| Wealthy Achievers, Suburban Areas |
9.82% |
14.99% |
65.49 |
|
| Affluent Greys, Rural Communities |
0.05% |
2.13% |
2.55 |
|
| Prosperous Pensioners, Retirement Areas |
1.30% |
2.49% |
52.40 |
|
| Affluent Executives, Family Areas |
4.81% |
4.43% |
108.64 |
|
| Well-Off Workers, Family Areas |
7.82% |
7.27% |
107.48 |
|
| Affluent Urbanites, Town & City Areas |
1.07% |
2.56% |
41.88 |
|
| Prosperous Professionals, Metropolitan Areas |
0.00% |
2.04% |
0.00 |
|
| Better-Off Executives, Inner City Areas |
3.47% |
3.94% |
88.11 |
|
| Comfortable Middle Agers, Mature Home Owning Areas |
13.24% |
13.04% |
101.52 |
|
| Skilled Workers, Home Owning Areas |
10.05% |
12.70% |
79.10 |
|
| New Home Owners, Mature Communities |
7.12% |
8.14% |
87.38 |
|
| White Collar Workers, Better-Off Multi Ethnic Areas |
4.06% |
4.02% |
100.94 |
|
| Older People, Less Prosperous Areas |
3.28% |
3.19% |
102.94 |
|
| Council Estate Residents, Better-Off Homes |
19.64% |
11.31% |
173.60 |
|
| Council Estate Residents, High Unemployment |
2.74% |
3.06% |
89.64 |
|
| Council Estate Residents, Greatest Hardship |
7.48% |
2.52% |
297.14 |
|
| People in Multi-Ethnic, Low-Income Areas |
3.80% |
2.10% |
180.72 |
|
| Unclassified |
0.25% |
0.06% |
406.42 |
|
|
 |
 |
 |
| £0-5K |
13.11% |
9.41% |
139.24 |
|
| £5-10K |
20.77% |
16.63% |
124.89 |
|
| £10-15K |
18.53% |
16.58% |
111.75 |
|
| £15-20K |
13.72% |
13.58% |
101.01 |
|
| £20-25K |
9.61% |
10.39% |
92.43 |
|
| £25-30K |
6.65% |
7.77% |
85.50 |
|
| £30-35K |
4.62% |
5.79% |
79.78 |
|
| £35-40K |
3.25% |
4.33% |
74.98 |
|
| £40-45K |
2.31% |
3.27% |
70.88 |
|
| £45-50K |
1.67% |
2.48% |
67.34 |
|
| £50-55K |
1.22% |
1.90% |
64.25 |
|
| £55-60K |
0.91% |
1.47% |
61.51 |
|
| £60-65K |
0.68% |
1.15% |
59.08 |
|
| £65-70K |
0.52% |
0.91% |
56.89 |
|
| £70-75K |
0.39% |
0.72% |
54.92 |
|
| £75-80K |
0.31% |
0.57% |
53.13 |
|
| £80-85K |
0.24% |
0.46% |
51.50 |
|
| £85-90K |
0.19% |
0.37% |
50.00 |
|
| £90-95K |
0.15% |
0.31% |
48.62 |
|
| £95-100K |
0.12% |
0.25% |
47.35 |
|
| £100K + |
0.55% |
1.34% |
41.17 |
|
|
|

|


|
1992-1997
|
1997-2001
|
|
|
|
| Con |
-15.72% |
| Lab |
7.96% |
| LD |
3.55% |
|
| Con |
-0.91% |
| Lab |
0.18% |
| LD |
4.94% |
|
|
 |
Margaret Beckett
Labour hold
|
| Con |
 |
10,455 |
24.27% |
| Lab |
 |
24,310 |
56.44% |
| LD |
 |
8,310 |
19.29% |
| Oth |
|
0 |
0.00% |
| Maj |
 |
13,855 |
32.16% |
| Turn |
 |
43,075 |
55.68% |
|
|
 |
Margaret Beckett
Labour hold
|
| L |
Margaret Beckett |
24,310 |
56.44% |
| LD |
Anders Hanson |
8,310 |
19.29% |
| C |
Simon Spencer |
10,455 |
24.27% |
|
Candidates representing 3 parties stood for election to this seat.
|
|
 |
Margaret Beckett
Labour
|
| Con |
 |
13,048 |
25.18% |
| Lab |
 |
29,154 |
56.26% |
| LD |
 |
7,438 |
14.35% |
| Ref |
 |
1,862 |
3.59% |
| Oth |
 |
317 |
0.61% |
| Maj |
 |
16,106 |
31.08% |
| Turn |
 |
51,819 |
67.84% |
|
|
 |
|
Labour
|
| Con |
 |
23,400 |
40.90% |
| Lab |
 |
27,627 |
48.30% |
| LD |
 |
6,195 |
10.80% |
| Oth |
|
0 |
0.00% |
| Maj |
 |
4,227 |
7.40% |
| Turn |
 |
57,222 |
75.63% |
|
|
 |
|

|

