|
Derbyshire North East
Labour hold

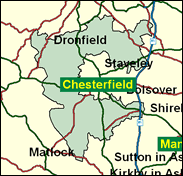
This constituency used to be dominated by heavy industry, particularly mining, and gritty working class communities such as Clay Cross and Eckington, but the pits have all closed and the social mix is greater now. A very large private housing development has spread near Dronfield in the Gosforth Valley, and the seat curls around Chesterfield into the Peak District foothills to take in desirable stone built villages like Wingerworth and Holymoorside. This is the basis for a substantial Conservative vote, still over 13,000 in number even after their share dropped by a hefty 13pc in 1997; but Labour's left wing stalwart Harry Barnes polled over 31,000 in one of the few (only) three-way contests of that election. An example of upward mobility in this constuituency is that of former world darts champion "Stoneface" John Lowe, whose success in this working class sport enabled him to move from Clay Cross to Wingerworth. But even with continuing economic change moving the oche, as it were, Labour still seems to be able to hit the bullseye with deadly accuracy.

Harry Barnes, MP here since 1987, a Durham miner’s son and railway clerk-turned-lecturer, got selected here on the back of his work in the extra-mural department at Sheffield University where his pupils included a number of miners who also became MPs in nearby coalfield seats. Born 1936 and educated at grammar school and Hull University, he has campaigned for Labour contesting seats in Northern Ireland, for updated electoral registers, and for disability rights. Self-mockingly described as ‘a little bald-headed 60 year-old man with glasses and false teeth and whose trousers do not match his jacket’, his real claim to fame is as one of Labour’s most rebellious backbenchers, second only to Skinner in opposition 1992-97, and since 1997 present, with his Campaign Group colleagues, in all the major revolts against the Government from lone parent benefit cuts in 1997 to air traffic control privatisation in 2000; in the language of Hull University researchers, one of ‘Blair’s Bastards.’
 |
| Wealthy Achievers, Suburban Areas |
17.16% |
14.99% |
114.42 |
|
| Affluent Greys, Rural Communities |
0.10% |
2.13% |
4.66 |
|
| Prosperous Pensioners, Retirement Areas |
0.58% |
2.49% |
23.46 |
|
| Affluent Executives, Family Areas |
5.32% |
4.43% |
120.13 |
|
| Well-Off Workers, Family Areas |
11.96% |
7.27% |
164.46 |
|
| Affluent Urbanites, Town & City Areas |
0.00% |
2.56% |
0.00 |
|
| Prosperous Professionals, Metropolitan Areas |
0.07% |
2.04% |
3.44 |
|
| Better-Off Executives, Inner City Areas |
0.00% |
3.94% |
0.00 |
|
| Comfortable Middle Agers, Mature Home Owning Areas |
17.51% |
13.04% |
134.31 |
|
| Skilled Workers, Home Owning Areas |
9.60% |
12.70% |
75.61 |
|
| New Home Owners, Mature Communities |
21.02% |
8.14% |
258.10 |
|
| White Collar Workers, Better-Off Multi Ethnic Areas |
0.04% |
4.02% |
0.97 |
|
| Older People, Less Prosperous Areas |
5.93% |
3.19% |
186.03 |
|
| Council Estate Residents, Better-Off Homes |
9.50% |
11.31% |
83.95 |
|
| Council Estate Residents, High Unemployment |
0.23% |
3.06% |
7.38 |
|
| Council Estate Residents, Greatest Hardship |
0.97% |
2.52% |
38.58 |
|
| People in Multi-Ethnic, Low-Income Areas |
0.00% |
2.10% |
0.00 |
|
| Unclassified |
0.02% |
0.06% |
32.14 |
|
|
 |
 |
 |
| £0-5K |
10.40% |
9.41% |
110.45 |
|
| £5-10K |
17.98% |
16.63% |
108.08 |
|
| £10-15K |
17.45% |
16.58% |
105.24 |
|
| £15-20K |
13.99% |
13.58% |
103.00 |
|
| £20-25K |
10.49% |
10.39% |
100.92 |
|
| £25-30K |
7.68% |
7.77% |
98.73 |
|
| £30-35K |
5.58% |
5.79% |
96.35 |
|
| £35-40K |
4.06% |
4.33% |
93.82 |
|
| £40-45K |
2.98% |
3.27% |
91.17 |
|
| £45-50K |
2.20% |
2.48% |
88.48 |
|
| £50-55K |
1.63% |
1.90% |
85.79 |
|
| £55-60K |
1.23% |
1.47% |
83.14 |
|
| £60-65K |
0.93% |
1.15% |
80.56 |
|
| £65-70K |
0.71% |
0.91% |
78.08 |
|
| £70-75K |
0.54% |
0.72% |
75.69 |
|
| £75-80K |
0.42% |
0.57% |
73.42 |
|
| £80-85K |
0.33% |
0.46% |
71.26 |
|
| £85-90K |
0.26% |
0.37% |
69.21 |
|
| £90-95K |
0.21% |
0.31% |
67.27 |
|
| £95-100K |
0.16% |
0.25% |
65.44 |
|
| £100K + |
0.76% |
1.34% |
56.21 |
|
|
|

|


|
1992-1997
|
1997-2001
|
|
|
|
| Con |
-12.99% |
| Lab |
11.66% |
| LD |
1.33% |
|
| Con |
1.33% |
| Lab |
-4.82% |
| LD |
3.49% |
|
|
 |
Harry Barnes
Labour hold
|
| Con |
 |
11,179 |
26.54% |
| Lab |
 |
23,437 |
55.64% |
| LD |
 |
7,508 |
17.82% |
| Oth |
|
0 |
0.00% |
| Maj |
 |
12,258 |
29.10% |
| Turn |
 |
42,124 |
100.00% |
|
|
 |
Harry Barnes
Labour hold
|
| L |
Harry Barnes |
23,437 |
55.64% |
| LD |
Mark Higginbottom |
7,508 |
17.82% |
| C |
James Hollingsworth |
11,179 |
26.54% |
|
Candidates representing 3 parties stood for election to this seat.
|
|
 |
Harry Barnes
Labour
|
| Con |
 |
13,104 |
25.21% |
| Lab |
 |
31,425 |
60.46% |
| LD |
 |
7,450 |
14.33% |
| Ref |
|
0 |
0.00% |
| Oth |
|
0 |
0.00% |
| Maj |
 |
18,321 |
35.25% |
| Turn |
 |
51,979 |
72.54% |
|
|
 |
|
Labour
|
| Con |
 |
22,590 |
38.20% |
| Lab |
 |
28,860 |
48.80% |
| LD |
 |
7,675 |
13.00% |
| Oth |
|
0 |
0.00% |
| Maj |
 |
6,270 |
10.60% |
| Turn |
 |
59,125 |
83.07% |
|
|
 |
|

|

