|
Derbyshire South
Labour hold

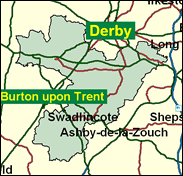
The previous MP Edwina Currie seems long gone, for all her eyecatching qualities during her 14 year tenure here from 1983-97, and Labour's polished and smart MP Mark Todd should establish himself firmly here at the Midlands end of the county (those from north Derbyshire resolutely deny that they are Midlanders and support soccer teams from Manchester or occasionally Sheffield not Derby or Nottingham). Ms Currie suffered a very large haemorrhage of support, almost 16pc, but this is more likely to be due to national and regional effects (Derby South's figure was almost identical) and the intervention of two anti-European candidates than to any particular personal unpopularity. The seat is a mixture of traditional Labour in the former coalfield around Swadlincote (described by one local, the late travel writer Rene Cutforth, as a "hole in the ground" in the old days) together with more Conservative country (Melbourne, Repton with its public school) and a couple of mixed wards on the southern edge of Derby.

Mark Todd, winner here in 1997, is a big, burly, bushy-moustached man with a Tory-style educational pedigree of public school and Cambridge (Sherborne and Emmanuel) and, indeed, a Tory MP grandfather. A former IT director in publishing, he cuts a commonsensical figure as a would-be reformer of the CAP and CSA, and has actually defended the Government’s part privatisation of air traffic control and opposed regulation of the use of dietary supplements (such as vitamin B6), believing individuals should make judgements for themselves. It has been said ‘he expounds Labour policy with friendly gravitas’ (Observer).
 |
| Wealthy Achievers, Suburban Areas |
17.67% |
14.99% |
117.86 |
|
| Affluent Greys, Rural Communities |
0.47% |
2.13% |
22.25 |
|
| Prosperous Pensioners, Retirement Areas |
0.86% |
2.49% |
34.56 |
|
| Affluent Executives, Family Areas |
4.50% |
4.43% |
101.75 |
|
| Well-Off Workers, Family Areas |
12.04% |
7.27% |
165.52 |
|
| Affluent Urbanites, Town & City Areas |
0.07% |
2.56% |
2.64 |
|
| Prosperous Professionals, Metropolitan Areas |
0.00% |
2.04% |
0.00 |
|
| Better-Off Executives, Inner City Areas |
0.27% |
3.94% |
6.75 |
|
| Comfortable Middle Agers, Mature Home Owning Areas |
16.43% |
13.04% |
125.99 |
|
| Skilled Workers, Home Owning Areas |
24.60% |
12.70% |
193.70 |
|
| New Home Owners, Mature Communities |
13.27% |
8.14% |
162.90 |
|
| White Collar Workers, Better-Off Multi Ethnic Areas |
0.16% |
4.02% |
3.96 |
|
| Older People, Less Prosperous Areas |
3.89% |
3.19% |
121.99 |
|
| Council Estate Residents, Better-Off Homes |
5.47% |
11.31% |
48.37 |
|
| Council Estate Residents, High Unemployment |
0.14% |
3.06% |
4.42 |
|
| Council Estate Residents, Greatest Hardship |
0.05% |
2.52% |
2.14 |
|
| People in Multi-Ethnic, Low-Income Areas |
0.00% |
2.10% |
0.00 |
|
| Unclassified |
0.12% |
0.06% |
187.87 |
|
|
 |
 |
 |
| £0-5K |
8.94% |
9.41% |
95.02 |
|
| £5-10K |
17.31% |
16.63% |
104.10 |
|
| £10-15K |
17.67% |
16.58% |
106.61 |
|
| £15-20K |
14.42% |
13.58% |
106.16 |
|
| £20-25K |
10.82% |
10.39% |
104.16 |
|
| £25-30K |
7.88% |
7.77% |
101.38 |
|
| £30-35K |
5.69% |
5.79% |
98.28 |
|
| £35-40K |
4.12% |
4.33% |
95.11 |
|
| £40-45K |
3.00% |
3.27% |
92.01 |
|
| £45-50K |
2.21% |
2.48% |
89.04 |
|
| £50-55K |
1.64% |
1.90% |
86.25 |
|
| £55-60K |
1.23% |
1.47% |
83.64 |
|
| £60-65K |
0.93% |
1.15% |
81.21 |
|
| £65-70K |
0.72% |
0.91% |
78.95 |
|
| £70-75K |
0.55% |
0.72% |
76.86 |
|
| £75-80K |
0.43% |
0.57% |
74.91 |
|
| £80-85K |
0.34% |
0.46% |
73.10 |
|
| £85-90K |
0.27% |
0.37% |
71.41 |
|
| £90-95K |
0.21% |
0.31% |
69.84 |
|
| £95-100K |
0.17% |
0.25% |
68.37 |
|
| £100K + |
0.82% |
1.34% |
60.93 |
|
|
|

|


|
1992-1997
|
1997-2001
|
|
|
|
| Con |
-15.95% |
| Lab |
10.44% |
| LD |
0.72% |
|
| Con |
4.37% |
| Lab |
-3.79% |
| LD |
1.07% |
|
|
 |
Mark Todd
Labour hold
|
| Con |
 |
18,487 |
35.62% |
| Lab |
 |
26,338 |
50.75% |
| LD |
 |
5,233 |
10.08% |
| Oth |
 |
1,837 |
3.54% |
| Maj |
 |
7,851 |
15.13% |
| Turn |
 |
51,895 |
64.06% |
|
|
 |
Mark Todd
Labour hold
|
| UK |
John Blunt |
1,024 |
1.97% |
| LD |
Russell Eagling |
5,233 |
10.08% |
| C |
James Hakewill |
18,487 |
35.62% |
| SA |
Paul Liversuch |
564 |
1.09% |
| Ind |
James Taylor |
249 |
0.48% |
| L |
Mark Todd |
26,338 |
50.75% |
|
Candidates representing 6 parties stood for election to this seat.
|
|
 |
Mark Todd
Labour gain
|
| Con |
 |
18,742 |
31.25% |
| Lab |
 |
32,709 |
54.54% |
| LD |
 |
5,408 |
9.02% |
| Ref |
 |
2,491 |
4.15% |
| Oth |
 |
617 |
1.03% |
| Maj |
 |
13,967 |
23.29% |
| Turn |
 |
59,967 |
78.21% |
|
|
 |
|
Conservative
|
| Con |
 |
29,825 |
47.20% |
| Lab |
 |
27,878 |
44.10% |
| LD |
 |
5,235 |
8.30% |
| Oth |
 |
291 |
0.50% |
| Maj |
 |
1,947 |
3.10% |
| Turn |
 |
63,229 |
84.83% |
|
|
 |
|

|

