|
Derbyshire West
Conservative hold

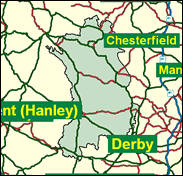
The local authority which effectively covers this constituency is Derbyshire Dales, which in the May 1999 local elections which took place throughout England (except London), produced the highest turnout anywhere in the country, over 46pc. Still far from spectacular, but given many observers' interest in turnout this does need some explanation. Rather than being the result of some unusual commitment to representative democracy, or a particularly hard-fought or even divisive set of contests, the reasons seem more prosaic: turnout in local elections tends to rise in more rural seats with identifiable village communities, more elderly, but still active, voters with time, interest and experience; and in more middle-class seats. In general, high turnout is an expression of stability and support for the system. This is scarcely surprising in the beautiful and largely peaceable - and largely Conservative and conservative - Derbyshire Dales. Turnout is well higher than average in General Elections too. This seat is mainly rural, but it does include some small Peak District towns such as the spa of Matlock, which is also the administrative headquarters of Derbyshire - not many people know that - and Bakewell, Ashbourne and the more Labour Wirksworth, with its limestone quarrying industry. It also takes in Belper, a different type of town with its former textile mills, not in the Peak but further east in the Amber Valley district. The closest this seat has been contested was in the 1986 by-election caused by the departure of Matthew Parris, switching from politics to journalism, when Patrick McLoughlin held of the challenge of Liberal Chris Walmsley by the round 100 votes. Now, though, with the arrival of Belper it is Labour that has moved into second place, but they are unlikely to get closer than they did in 1997.

Patrick McLoughlin, MP here since 1986, the Conservative Deputy Chief Whip, is both a collector’s item and a rhetorical point, as a Tory MP who was a coal miner and sitting for a seat once the property of the Dukes of Devonshire. Dark, burly and not overly fluent, Staffordshire-accented with a lisp, he was born 1957 and educated at Cardinal Griffin (RC) Secondary Modern, Cannock, and Staffordshire College of Agriculture, and initially worked as a farm labourer before spending six years at Littleton Colliery, Cannock. To the snob Alan Clark he was: ‘ a nice man, but not a card of very high value’.
 |
| Wealthy Achievers, Suburban Areas |
27.06% |
14.99% |
180.51 |
|
| Affluent Greys, Rural Communities |
7.59% |
2.13% |
357.05 |
|
| Prosperous Pensioners, Retirement Areas |
1.29% |
2.49% |
51.96 |
|
| Affluent Executives, Family Areas |
2.49% |
4.43% |
56.35 |
|
| Well-Off Workers, Family Areas |
1.77% |
7.27% |
24.37 |
|
| Affluent Urbanites, Town & City Areas |
0.22% |
2.56% |
8.77 |
|
| Prosperous Professionals, Metropolitan Areas |
0.00% |
2.04% |
0.00 |
|
| Better-Off Executives, Inner City Areas |
0.26% |
3.94% |
6.54 |
|
| Comfortable Middle Agers, Mature Home Owning Areas |
26.81% |
13.04% |
205.60 |
|
| Skilled Workers, Home Owning Areas |
11.04% |
12.70% |
86.88 |
|
| New Home Owners, Mature Communities |
12.58% |
8.14% |
154.54 |
|
| White Collar Workers, Better-Off Multi Ethnic Areas |
1.67% |
4.02% |
41.62 |
|
| Older People, Less Prosperous Areas |
3.37% |
3.19% |
105.68 |
|
| Council Estate Residents, Better-Off Homes |
3.74% |
11.31% |
33.05 |
|
| Council Estate Residents, High Unemployment |
0.09% |
3.06% |
3.01 |
|
| Council Estate Residents, Greatest Hardship |
0.00% |
2.52% |
0.00 |
|
| People in Multi-Ethnic, Low-Income Areas |
0.00% |
2.10% |
0.00 |
|
| Unclassified |
0.01% |
0.06% |
8.51 |
|
|
 |
 |
 |
| £0-5K |
7.44% |
9.41% |
78.99 |
|
| £5-10K |
15.17% |
16.63% |
91.18 |
|
| £10-15K |
16.40% |
16.58% |
98.94 |
|
| £15-20K |
14.10% |
13.58% |
103.84 |
|
| £20-25K |
11.10% |
10.39% |
106.79 |
|
| £25-30K |
8.43% |
7.77% |
108.44 |
|
| £30-35K |
6.32% |
5.79% |
109.19 |
|
| £35-40K |
4.74% |
4.33% |
109.34 |
|
| £40-45K |
3.56% |
3.27% |
109.09 |
|
| £45-50K |
2.69% |
2.48% |
108.56 |
|
| £50-55K |
2.05% |
1.90% |
107.86 |
|
| £55-60K |
1.58% |
1.47% |
107.05 |
|
| £60-65K |
1.22% |
1.15% |
106.18 |
|
| £65-70K |
0.95% |
0.91% |
105.28 |
|
| £70-75K |
0.75% |
0.72% |
104.37 |
|
| £75-80K |
0.59% |
0.57% |
103.46 |
|
| £80-85K |
0.47% |
0.46% |
102.57 |
|
| £85-90K |
0.38% |
0.37% |
101.71 |
|
| £90-95K |
0.31% |
0.31% |
100.88 |
|
| £95-100K |
0.25% |
0.25% |
100.08 |
|
| £100K + |
1.29% |
1.34% |
95.85 |
|
|
|

|


|
1992-1997
|
1997-2001
|
|
|
|
| Con |
-12.10% |
| Lab |
11.21% |
| LD |
-6.03% |
|
| Con |
5.90% |
| Lab |
-0.08% |
| LD |
-1.81% |
|
|
 |
Patrick McLoughlin
Conservative hold
|
| Con |
 |
24,280 |
47.99% |
| Lab |
 |
16,910 |
33.43% |
| LD |
 |
7,922 |
15.66% |
| Oth |
 |
1,477 |
2.92% |
| Maj |
 |
7,370 |
14.57% |
| Turn |
 |
50,589 |
67.39% |
|
|
 |
Patrick McLoughlin
Conservative hold
|
| UK |
Stuart Bavester |
672 |
1.33% |
| LD |
Jeremy Beckett |
7,922 |
15.66% |
| L |
Stephen Clamp |
16,910 |
33.43% |
| ML |
Nick Delves |
472 |
0.93% |
| I |
Robert Goodall |
333 |
0.66% |
| C |
Patrick McLoughlin |
24,280 |
47.99% |
|
Candidates representing 6 parties stood for election to this seat.
|
|
 |
Patrick McLoughlin
Conservative
|
| Con |
 |
23,945 |
42.10% |
| Lab |
 |
19,060 |
33.51% |
| LD |
 |
9,940 |
17.47% |
| Ref |
 |
2,499 |
4.39% |
| Oth |
 |
1,439 |
2.53% |
| Maj |
 |
4,885 |
8.59% |
| Turn |
 |
56,883 |
78.23% |
|
|
 |
|
Conservative
|
| Con |
 |
31,944 |
54.20% |
| Lab |
 |
13,164 |
22.30% |
| LD |
 |
13,824 |
23.50% |
| Oth |
|
0 |
0.00% |
| Maj |
 |
18,120 |
30.70% |
| Turn |
 |
58,932 |
84.00% |
|
|
 |
|

|

