|
Devon North
Liberal Democrat hold

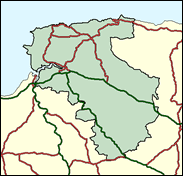
Although the Conservatives polled the most votes cast within Devon North in the regional - Euro-elections in 1999, the sitting MP Nick Harvey is generally regarded as the most sceptical parliamentarian in his party (on this issue), and this should serve his bid for re-election well here in an archetypal West Country Liberal seat. North Devon is stepped with Liberalism. This was the seat of former party leader Jeremy Thorpe for 20 years before his defeat, and that was largely because of the court case in which he was acquitted of a conspiracy plot involving attempted murder and other "unnatural" practices such as homosexuality and canicide. At local level the Liberal Democrats sweep home in the largest town, the surprisingly industrial and working class Barnstaple, and fading seaside resorts like Ilfracombe on the so-called Golden Coast. Nick Harvey appears safe here for the time being.

Nick Harvey has held this seat for the Liberal Democrats since 1992, when he avenged the 1979 defeat of the hapless Jeremy Thorpe. His Party's Health spokesman, he is tall, balding, genial and with a slight lisp. He was born 1961, educated at Queen's College, Taunton, and Middlesex Polytechnic, and worked in parliamentary consultancy. For long his party’s sole Eurosceptic, voting against Maastricht, he was a good deal more representative of his Devonian electors than the Eurofanatics at the top of his party; though latterly he has trimmed to accept the reality of the Euro.
 |
| Wealthy Achievers, Suburban Areas |
8.65% |
14.99% |
57.67 |
|
| Affluent Greys, Rural Communities |
21.81% |
2.13% |
1,025.64 |
|
| Prosperous Pensioners, Retirement Areas |
7.99% |
2.49% |
321.29 |
|
| Affluent Executives, Family Areas |
2.92% |
4.43% |
65.91 |
|
| Well-Off Workers, Family Areas |
1.21% |
7.27% |
16.64 |
|
| Affluent Urbanites, Town & City Areas |
0.38% |
2.56% |
14.87 |
|
| Prosperous Professionals, Metropolitan Areas |
0.00% |
2.04% |
0.00 |
|
| Better-Off Executives, Inner City Areas |
2.20% |
3.94% |
55.83 |
|
| Comfortable Middle Agers, Mature Home Owning Areas |
20.57% |
13.04% |
157.73 |
|
| Skilled Workers, Home Owning Areas |
11.75% |
12.70% |
92.51 |
|
| New Home Owners, Mature Communities |
6.35% |
8.14% |
77.93 |
|
| White Collar Workers, Better-Off Multi Ethnic Areas |
5.90% |
4.02% |
146.80 |
|
| Older People, Less Prosperous Areas |
3.61% |
3.19% |
113.27 |
|
| Council Estate Residents, Better-Off Homes |
4.86% |
11.31% |
42.95 |
|
| Council Estate Residents, High Unemployment |
0.66% |
3.06% |
21.46 |
|
| Council Estate Residents, Greatest Hardship |
1.13% |
2.52% |
44.91 |
|
| People in Multi-Ethnic, Low-Income Areas |
0.00% |
2.10% |
0.00 |
|
| Unclassified |
0.03% |
0.06% |
41.47 |
|
|
 |
 |
 |
| £0-5K |
10.85% |
9.41% |
115.29 |
|
| £5-10K |
21.29% |
16.63% |
128.03 |
|
| £10-15K |
20.34% |
16.58% |
122.68 |
|
| £15-20K |
15.14% |
13.58% |
111.45 |
|
| £20-25K |
10.33% |
10.39% |
99.41 |
|
| £25-30K |
6.87% |
7.77% |
88.32 |
|
| £30-35K |
4.56% |
5.79% |
78.64 |
|
| £35-40K |
3.05% |
4.33% |
70.36 |
|
| £40-45K |
2.07% |
3.27% |
63.33 |
|
| £45-50K |
1.42% |
2.48% |
57.34 |
|
| £50-55K |
0.99% |
1.90% |
52.24 |
|
| £55-60K |
0.71% |
1.47% |
47.85 |
|
| £60-65K |
0.51% |
1.15% |
44.06 |
|
| £65-70K |
0.37% |
0.91% |
40.77 |
|
| £70-75K |
0.27% |
0.72% |
37.89 |
|
| £75-80K |
0.20% |
0.57% |
35.35 |
|
| £80-85K |
0.15% |
0.46% |
33.11 |
|
| £85-90K |
0.12% |
0.37% |
31.11 |
|
| £90-95K |
0.09% |
0.31% |
29.32 |
|
| £95-100K |
0.07% |
0.25% |
27.71 |
|
| £100K + |
0.28% |
1.34% |
20.82 |
|
|
|

|


|
1992-1997
|
1997-2001
|
|
|
|
| Con |
-6.23% |
| Lab |
3.89% |
| LD |
3.64% |
|
| Con |
-1.30% |
| Lab |
0.35% |
| LD |
-6.51% |
|
|
 |
Nick Harvey
Liberal Democrat hold
|
| Con |
 |
18,800 |
38.17% |
| Lab |
 |
4,995 |
10.14% |
| LD |
 |
21,784 |
44.23% |
| Oth |
 |
3,675 |
7.46% |
| Maj |
 |
2,984 |
6.06% |
| Turn |
 |
49,254 |
68.31% |
|
|
 |
Nick Harvey
Liberal Democrat hold
|
| C |
Clive Allen |
18,800 |
38.17% |
| G |
Tony Bown |
1,191 |
2.42% |
| L |
Viv Gale |
4,995 |
10.14% |
| LD |
Nick Harvey |
21,784 |
44.23% |
| UK |
Roger Knapman |
2,484 |
5.04% |
|
Candidates representing 5 parties stood for election to this seat.
|
|
 |
Nick Harvey
Liberal Democrat
|
| Con |
 |
21,643 |
39.47% |
| Lab |
 |
5,367 |
9.79% |
| LD |
 |
27,824 |
50.74% |
| Ref |
|
0 |
0.00% |
| Oth |
|
0 |
0.00% |
| Maj |
 |
6,181 |
11.27% |
| Turn |
 |
54,834 |
77.94% |
|
|
 |
|
Liberal Democrat
|
| Con |
 |
26,596 |
45.70% |
| Lab |
 |
3,406 |
5.90% |
| LD |
 |
27,389 |
47.10% |
| Oth |
 |
764 |
1.30% |
| Maj |
 |
793 |
1.40% |
| Turn |
 |
58,155 |
83.02% |
|
|
 |
|

|

