|
Ashford
Conservative hold

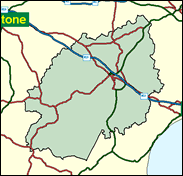
Although eight seats fell to Labour in Kent in 1997, it is sometimes forgotten that nine remained Conservative. These included Ashford, where growth associated with the Channel Tunnel and the general proximity to the continent has provided wealth and population growth. The seat also includes a large number of very Conservative villages (The Darling Buds of May was filmed here) and the extremely affluent town of Tenterden out towards the Weald and the Sussex border. It looks as if it will provide a comfortable platform for Damian Green's rapidly developing parliamentary career.

Damian Green, an environment spokesman, is one of a mere handful of Ken Clarke-supporting One Nation Conservatives elected in 1997. Born 1958 and educated at Reading School and Balliol College, Oxford, he was a financial journalist before working at Downing Street under John Major. An out-of-step, out-of-time Europhile, he has urged his Tory Reform Group colleagues to resist the rightwing obsession with cutting public spending and pitch for higer standards in public services, and would be high in any Shadow Cabinet under Kenneth Clarke, should his party pitch pragmatically for office post-Hague.

 |
| Wealthy Achievers, Suburban Areas |
27.12% |
14.99% |
180.85 |
|
| Affluent Greys, Rural Communities |
0.65% |
2.13% |
30.51 |
|
| Prosperous Pensioners, Retirement Areas |
2.33% |
2.49% |
93.79 |
|
| Affluent Executives, Family Areas |
5.71% |
4.43% |
129.08 |
|
| Well-Off Workers, Family Areas |
9.20% |
7.27% |
126.55 |
|
| Affluent Urbanites, Town & City Areas |
0.94% |
2.56% |
36.84 |
|
| Prosperous Professionals, Metropolitan Areas |
0.60% |
2.04% |
29.21 |
|
| Better-Off Executives, Inner City Areas |
0.30% |
3.94% |
7.56 |
|
| Comfortable Middle Agers, Mature Home Owning Areas |
19.42% |
13.04% |
148.93 |
|
| Skilled Workers, Home Owning Areas |
8.70% |
12.70% |
68.46 |
|
| New Home Owners, Mature Communities |
7.16% |
8.14% |
87.88 |
|
| White Collar Workers, Better-Off Multi Ethnic Areas |
1.31% |
4.02% |
32.65 |
|
| Older People, Less Prosperous Areas |
0.94% |
3.19% |
29.39 |
|
| Council Estate Residents, Better-Off Homes |
14.68% |
11.31% |
129.75 |
|
| Council Estate Residents, High Unemployment |
0.02% |
3.06% |
0.60 |
|
| Council Estate Residents, Greatest Hardship |
0.85% |
2.52% |
33.57 |
|
| People in Multi-Ethnic, Low-Income Areas |
0.00% |
2.10% |
0.00 |
|
| Unclassified |
0.09% |
0.06% |
142.18 |
|
|
 |
 |
 |
| £0-5K |
8.53% |
9.41% |
90.57 |
|
| £5-10K |
15.68% |
16.63% |
94.26 |
|
| £10-15K |
16.26% |
16.58% |
98.05 |
|
| £15-20K |
13.65% |
13.58% |
100.50 |
|
| £20-25K |
10.59% |
10.39% |
101.91 |
|
| £25-30K |
7.98% |
7.77% |
102.60 |
|
| £30-35K |
5.95% |
5.79% |
102.79 |
|
| £35-40K |
4.45% |
4.33% |
102.66 |
|
| £40-45K |
3.34% |
3.27% |
102.31 |
|
| £45-50K |
2.53% |
2.48% |
101.81 |
|
| £50-55K |
1.93% |
1.90% |
101.22 |
|
| £55-60K |
1.48% |
1.47% |
100.58 |
|
| £60-65K |
1.15% |
1.15% |
99.92 |
|
| £65-70K |
0.90% |
0.91% |
99.26 |
|
| £70-75K |
0.71% |
0.72% |
98.60 |
|
| £75-80K |
0.56% |
0.57% |
97.96 |
|
| £80-85K |
0.45% |
0.46% |
97.34 |
|
| £85-90K |
0.36% |
0.37% |
96.75 |
|
| £90-95K |
0.29% |
0.31% |
96.18 |
|
| £95-100K |
0.24% |
0.25% |
95.64 |
|
| £100K + |
1.25% |
1.34% |
92.99 |
|
|
|

|


|
1992-1997
|
1997-2001
|
|
|
|
| Con |
-13.19% |
| Lab |
11.73% |
| LD |
-4.39% |
|
| Con |
6.02% |
| Lab |
0.36% |
| LD |
-4.62% |
|
|
 |
Damian Green
Conservative hold
|
| Con |
 |
22,739 |
47.44% |
| Lab |
 |
15,380 |
32.08% |
| LD |
 |
7,236 |
15.09% |
| Oth |
 |
2,582 |
5.39% |
| Maj |
 |
7,359 |
15.35% |
| Turn |
 |
47,937 |
62.50% |
|
|
 |
Damian Green
Conservative hold
|
| L |
John Adams |
15,380 |
32.08% |
| G |
Richard Boden |
1,353 |
2.82% |
| LD |
Keith Fitchett |
7,236 |
15.09% |
| C |
Damian Green |
22,739 |
47.44% |
| UK |
David Waller |
1,229 |
2.56% |
|
Candidates representing 5 parties stood for election to this seat.
|
|
 |
Damian Green
Conservative
|
| Con |
 |
22,899 |
41.41% |
| Lab |
 |
17,544 |
31.73% |
| LD |
 |
10,901 |
19.71% |
| Ref |
 |
3,201 |
5.79% |
| Oth |
 |
749 |
1.35% |
| Maj |
 |
5,355 |
9.68% |
| Turn |
 |
55,294 |
74.57% |
|
|
 |
|
Conservative
|
| Con |
 |
31,030 |
54.60% |
| Lab |
 |
11,365 |
20.00% |
| LD |
 |
13,671 |
24.10% |
| Oth |
 |
773 |
1.40% |
| Maj |
 |
17,359 |
30.50% |
| Turn |
 |
56,839 |
78.71% |
|
|
 |
|

|

