|
Dewsbury
Labour hold

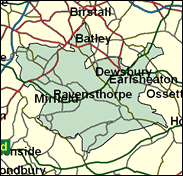
For what it is worth, Labour party Chief Whip Ann Taylor has the most vulnerable seat of any Cabinet member in terms of majority, but this is only relative, as it would require a swing of 10pc to the Conservatives to defeat her. This is not to say that she will remain in the Cabinet after the election though; that is up to Tony Blair as well as the voters of Dewsbury. They may well yet have their say, for the latest local election evidence from the Kirklees Metropolitan Borough elections of May 2000 is not very favourable, as Labour lost out to both Conservatives in Mirfield and Thornhill and Liberal Democrats in Dewsbury itself. Labour did relatively very poorly in 1997 too, only increasing their share of the vote by two per cent compared with a national average of eleven. Not only is this due to a poor performance throughout West Yorkshire in the local elections of 2000, but to specific factors in Dewsbury. There have been bitter disputes about the state of education in schools with largely Asian rolls, and race relations could be considerably better. The British National Party candidate saved her deposit in 1997 (though it might be noted that her surname was also Taylor, so some confusion may have exacerbated the effect), and there was an Independent Labour hopeful in the lists as well.

Ann Taylor, Labour’s first female Chief Whip, got her first post - as an Assistant Whip - from Jim Callaghan in 1977, aged 30. Elected for Bolton West (1974-83) and for Dewsbury in 1987, she was born 1947, educated at Bolton School and Bradford and Sheffield Universities. From the party’s Old right she has defended MPs working for lobbyists (as she did for Westminster Communications) and is conservative on homosexual law reform. She sports a very severe short-back-and-sides-but-long-on-top hair cut and is blessed with a somewhat metallic voice. Under her rule, MPs’ performance and rebellions have been reported on to CLPs, a straight reversal of the deselection process in opposition, in which the CLPs sacked the MPs for not rebelling.
 |
| Wealthy Achievers, Suburban Areas |
7.62% |
14.99% |
50.85 |
|
| Affluent Greys, Rural Communities |
0.01% |
2.13% |
0.44 |
|
| Prosperous Pensioners, Retirement Areas |
0.00% |
2.49% |
0.00 |
|
| Affluent Executives, Family Areas |
0.06% |
4.43% |
1.40 |
|
| Well-Off Workers, Family Areas |
10.19% |
7.27% |
140.09 |
|
| Affluent Urbanites, Town & City Areas |
0.00% |
2.56% |
0.00 |
|
| Prosperous Professionals, Metropolitan Areas |
0.00% |
2.04% |
0.00 |
|
| Better-Off Executives, Inner City Areas |
0.00% |
3.94% |
0.00 |
|
| Comfortable Middle Agers, Mature Home Owning Areas |
9.93% |
13.04% |
76.17 |
|
| Skilled Workers, Home Owning Areas |
20.79% |
12.70% |
163.67 |
|
| New Home Owners, Mature Communities |
5.99% |
8.14% |
73.52 |
|
| White Collar Workers, Better-Off Multi Ethnic Areas |
1.00% |
4.02% |
24.95 |
|
| Older People, Less Prosperous Areas |
7.08% |
3.19% |
222.20 |
|
| Council Estate Residents, Better-Off Homes |
23.80% |
11.31% |
210.45 |
|
| Council Estate Residents, High Unemployment |
2.28% |
3.06% |
74.59 |
|
| Council Estate Residents, Greatest Hardship |
2.99% |
2.52% |
118.72 |
|
| People in Multi-Ethnic, Low-Income Areas |
8.25% |
2.10% |
392.70 |
|
| Unclassified |
0.00% |
0.06% |
0.00 |
|
|
 |
 |
 |
| £0-5K |
10.66% |
9.41% |
113.20 |
|
| £5-10K |
18.04% |
16.63% |
108.44 |
|
| £10-15K |
17.65% |
16.58% |
106.46 |
|
| £15-20K |
14.17% |
13.58% |
104.30 |
|
| £20-25K |
10.55% |
10.39% |
101.52 |
|
| £25-30K |
7.64% |
7.77% |
98.29 |
|
| £30-35K |
5.49% |
5.79% |
94.80 |
|
| £35-40K |
3.95% |
4.33% |
91.25 |
|
| £40-45K |
2.87% |
3.27% |
87.77 |
|
| £45-50K |
2.10% |
2.48% |
84.44 |
|
| £50-55K |
1.55% |
1.90% |
81.30 |
|
| £55-60K |
1.16% |
1.47% |
78.37 |
|
| £60-65K |
0.87% |
1.15% |
75.67 |
|
| £65-70K |
0.66% |
0.91% |
73.18 |
|
| £70-75K |
0.51% |
0.72% |
70.89 |
|
| £75-80K |
0.40% |
0.57% |
68.79 |
|
| £80-85K |
0.31% |
0.46% |
66.87 |
|
| £85-90K |
0.24% |
0.37% |
65.12 |
|
| £90-95K |
0.19% |
0.31% |
63.51 |
|
| £95-100K |
0.16% |
0.25% |
62.04 |
|
| £100K + |
0.75% |
1.34% |
55.67 |
|
|
|

|


|
1992-1997
|
1997-2001
|
|
|
|
| Con |
-9.91% |
| Lab |
2.12% |
| LD |
0.37% |
|
| Con |
0.12% |
| Lab |
1.13% |
| LD |
1.69% |
|
|
 |
Ann Taylor
Labour hold
|
| Con |
 |
11,075 |
30.22% |
| Lab |
 |
18,524 |
50.54% |
| LD |
 |
4,382 |
11.96% |
| Oth |
 |
2,670 |
7.28% |
| Maj |
 |
7,449 |
20.32% |
| Turn |
 |
36,651 |
58.79% |
|
|
 |
Ann Taylor
Labour hold
|
| C |
Robert Cole |
11,075 |
30.22% |
| LD |
Ian Cuthbertson |
4,382 |
11.96% |
| UK |
David Pearce |
560 |
1.53% |
| BNP |
Russell Smith |
478 |
1.30% |
| G |
Brenda Smithson |
1,632 |
4.45% |
| L |
Ann Taylor |
18,524 |
50.54% |
|
Candidates representing 6 parties stood for election to this seat.
|
|
 |
Ann Taylor
Labour
|
| Con |
 |
12,963 |
30.09% |
| Lab |
 |
21,286 |
49.42% |
| LD |
 |
4,422 |
10.27% |
| Ref |
 |
1,019 |
2.37% |
| Oth |
 |
3,385 |
7.86% |
| Maj |
 |
8,323 |
19.32% |
| Turn |
 |
43,075 |
70.01% |
|
|
 |
|
Labour
|
| Con |
 |
19,637 |
40.00% |
| Lab |
 |
23,186 |
47.30% |
| LD |
 |
4,835 |
9.90% |
| Oth |
 |
1,385 |
2.80% |
| Maj |
 |
3,549 |
7.20% |
| Turn |
 |
49,043 |
80.12% |
|
|
 |
|

|

