|
Don Valley
Labour hold

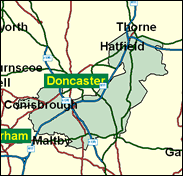
Once monolithically Labour, the Don Valley seat seems almost to have been redrawn by the Boundary Commission to increase the Tory vote. The most middle class ward of Doncaster town itself, South East around Bessacarr has been detached from the Central seat. Also Conservative is Southern Parks, which takes in a series of non-mining villages and small towns like Tickhill. Hatfield was a three way marginal ward in May 2000. On the other hand there are solidly working class communities forged by coal mining, such as New Edlington, Warmsworth and New Rossington, abnd Conisbrough with its incongruous medieval castle set amongst the grime. In 1992 if this seat had existed under its current boundaries it is estimated that Labour would have won, but only by 51pc to 38pc for the Tories - a very good showing by their standards in South Yorkshire. Of course they slipped back by the standard double figure percentage in 1997, but still achieved a five figure vote, and could in theory use their base here to challenge for victory should they ever again reach the heady heights of the 1980s.

Caroline Flint represents the feminisation of the Yorkshire coalfield as one of three metropolitan women parachuted in 1997 into seats reserved since the dawn of time for miners. A remarkably vivacious, ultra-loyal bowler of stooge questions, an ex-GMB researcher, and equal opportunities officer, she adds substantially to her MP’s salary as adviser to the Police Federation. She was born in 1961 and educated at Twickenham Girls’ School and East Anglia University.
 |
| Wealthy Achievers, Suburban Areas |
18.64% |
14.99% |
124.32 |
|
| Affluent Greys, Rural Communities |
0.00% |
2.13% |
0.00 |
|
| Prosperous Pensioners, Retirement Areas |
1.01% |
2.49% |
40.72 |
|
| Affluent Executives, Family Areas |
6.94% |
4.43% |
156.87 |
|
| Well-Off Workers, Family Areas |
13.67% |
7.27% |
187.96 |
|
| Affluent Urbanites, Town & City Areas |
0.19% |
2.56% |
7.29 |
|
| Prosperous Professionals, Metropolitan Areas |
0.00% |
2.04% |
0.00 |
|
| Better-Off Executives, Inner City Areas |
0.00% |
3.94% |
0.00 |
|
| Comfortable Middle Agers, Mature Home Owning Areas |
12.59% |
13.04% |
96.58 |
|
| Skilled Workers, Home Owning Areas |
11.59% |
12.70% |
91.24 |
|
| New Home Owners, Mature Communities |
13.49% |
8.14% |
165.72 |
|
| White Collar Workers, Better-Off Multi Ethnic Areas |
0.00% |
4.02% |
0.00 |
|
| Older People, Less Prosperous Areas |
1.81% |
3.19% |
56.90 |
|
| Council Estate Residents, Better-Off Homes |
16.45% |
11.31% |
145.47 |
|
| Council Estate Residents, High Unemployment |
0.30% |
3.06% |
9.66 |
|
| Council Estate Residents, Greatest Hardship |
3.31% |
2.52% |
131.37 |
|
| People in Multi-Ethnic, Low-Income Areas |
0.00% |
2.10% |
0.00 |
|
| Unclassified |
0.00% |
0.06% |
0.00 |
|
|
 |
 |
 |
| £0-5K |
10.98% |
9.41% |
116.62 |
|
| £5-10K |
19.38% |
16.63% |
116.54 |
|
| £10-15K |
18.12% |
16.58% |
109.32 |
|
| £15-20K |
13.92% |
13.58% |
102.51 |
|
| £20-25K |
10.07% |
10.39% |
96.91 |
|
| £25-30K |
7.18% |
7.77% |
92.31 |
|
| £30-35K |
5.12% |
5.79% |
88.46 |
|
| £35-40K |
3.69% |
4.33% |
85.16 |
|
| £40-45K |
2.69% |
3.27% |
82.29 |
|
| £45-50K |
1.98% |
2.48% |
79.76 |
|
| £50-55K |
1.48% |
1.90% |
77.51 |
|
| £55-60K |
1.11% |
1.47% |
75.49 |
|
| £60-65K |
0.85% |
1.15% |
73.66 |
|
| £65-70K |
0.65% |
0.91% |
71.99 |
|
| £70-75K |
0.51% |
0.72% |
70.46 |
|
| £75-80K |
0.40% |
0.57% |
69.06 |
|
| £80-85K |
0.31% |
0.46% |
67.77 |
|
| £85-90K |
0.25% |
0.37% |
66.57 |
|
| £90-95K |
0.20% |
0.31% |
65.45 |
|
| £95-100K |
0.16% |
0.25% |
64.40 |
|
| £100K + |
0.79% |
1.34% |
58.90 |
|
|
|

|


|
1992-1997
|
1997-2001
|
|
|
|
| Con |
-12.20% |
| Lab |
7.66% |
| LD |
-1.37% |
|
| Con |
4.67% |
| Lab |
-2.42% |
| LD |
1.68% |
|
|
 |
Caroline Flint
Labour hold
|
| Con |
 |
10,489 |
29.27% |
| Lab |
 |
20,009 |
55.84% |
| LD |
 |
4,089 |
11.41% |
| Oth |
 |
1,243 |
3.47% |
| Maj |
 |
9,520 |
26.57% |
| Turn |
 |
35,830 |
54.09% |
|
|
 |
Caroline Flint
Labour hold
|
| SL |
Nigel Ball |
466 |
1.30% |
| C |
James Browne |
10,489 |
29.27% |
| UK |
David Cooper |
777 |
2.17% |
| L |
Caroline Flint |
20,009 |
55.84% |
| LD |
Phillip Smith |
4,089 |
11.41% |
|
Candidates representing 5 parties stood for election to this seat.
|
|
 |
Caroline Flint
Labour
|
| Con |
 |
10,717 |
24.60% |
| Lab |
 |
25,376 |
58.26% |
| LD |
 |
4,238 |
9.73% |
| Ref |
 |
1,379 |
3.17% |
| Oth |
 |
1,847 |
4.24% |
| Maj |
 |
14,659 |
33.65% |
| Turn |
 |
43,557 |
66.35% |
|
|
 |
|
Labour
|
| Con |
 |
18,927 |
36.80% |
| Lab |
 |
26,046 |
50.60% |
| LD |
 |
5,718 |
11.10% |
| Oth |
 |
803 |
1.60% |
| Maj |
 |
7,119 |
13.80% |
| Turn |
 |
51,494 |
78.75% |
|
|
 |
|

|

