|
Doncaster Central
Labour hold

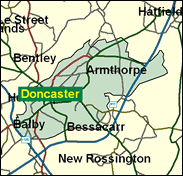
The "Socialist Republic of South Yorkshire", as it was once known, as not always been as monolithically Labour as it is now, with just one Liberal Democrat seat in the shape of Sheffield Hallam breaking the monopoly. From 1951 to 1964 Doncaster was the constituency of Anthony Barber, who was to become the Chancellor of the Exchequer in the Heath government, and even in 1970 and 1979 his successor Harold Walker, later to become a Deputy Speaker, held it for Labour by less than 3,000. Doncaster is a mixed town of many industries, rather than dependent on any one, even though it was for the most of the twentieth century the centre of one of the most productive modern coalfields in the country. There was a large middle class sector in the south east, beyond the famous racecourse, home of the St Leger and Oaks. Doncaster was the commercial, retail and communications centre of the surrounding sub-region, and had to be considered a marginal seat for most of the second half of the century. Now however things look different. Boundary changes have removed the middle class residential area. The long-term regional swing has been strongly pro-Labour. Finally after the short term events of 1997 Rosie Winterton had built up a majority of 18,000, and any hint of marginaliity is firmly fixed in the past.

One of three women inheriting safe Labour seats on the macho Yorkshire coalfield in 1997, Rosie Winterton came with the stamp of John Prescott’s approval as his PA at Westminster (and previously in Hull). Born 1958 and educated at Ackworth School (private), Doncaster Grammar School and Hull University, like other Prescott allies she has not advanced in government. Her neighbour, Caroline Flint, conceded that not all Blair’s Babes were Barbara Castles; this one has been likened to Barbara Windsor.
 |
| Wealthy Achievers, Suburban Areas |
6.63% |
14.99% |
44.20 |
|
| Affluent Greys, Rural Communities |
0.00% |
2.13% |
0.00 |
|
| Prosperous Pensioners, Retirement Areas |
2.08% |
2.49% |
83.64 |
|
| Affluent Executives, Family Areas |
1.44% |
4.43% |
32.50 |
|
| Well-Off Workers, Family Areas |
7.29% |
7.27% |
100.19 |
|
| Affluent Urbanites, Town & City Areas |
1.07% |
2.56% |
41.80 |
|
| Prosperous Professionals, Metropolitan Areas |
0.00% |
2.04% |
0.00 |
|
| Better-Off Executives, Inner City Areas |
4.46% |
3.94% |
113.08 |
|
| Comfortable Middle Agers, Mature Home Owning Areas |
11.08% |
13.04% |
84.96 |
|
| Skilled Workers, Home Owning Areas |
24.88% |
12.70% |
195.87 |
|
| New Home Owners, Mature Communities |
17.50% |
8.14% |
214.95 |
|
| White Collar Workers, Better-Off Multi Ethnic Areas |
1.46% |
4.02% |
36.32 |
|
| Older People, Less Prosperous Areas |
4.34% |
3.19% |
136.12 |
|
| Council Estate Residents, Better-Off Homes |
10.94% |
11.31% |
96.76 |
|
| Council Estate Residents, High Unemployment |
2.56% |
3.06% |
83.62 |
|
| Council Estate Residents, Greatest Hardship |
4.27% |
2.52% |
169.60 |
|
| People in Multi-Ethnic, Low-Income Areas |
0.00% |
2.10% |
0.00 |
|
| Unclassified |
0.00% |
0.06% |
0.00 |
|
|
 |
 |
 |
| £0-5K |
14.51% |
9.41% |
154.18 |
|
| £5-10K |
22.53% |
16.63% |
135.47 |
|
| £10-15K |
19.24% |
16.58% |
116.06 |
|
| £15-20K |
13.66% |
13.58% |
100.55 |
|
| £20-25K |
9.20% |
10.39% |
88.54 |
|
| £25-30K |
6.15% |
7.77% |
79.13 |
|
| £30-35K |
4.15% |
5.79% |
71.60 |
|
| £35-40K |
2.84% |
4.33% |
65.45 |
|
| £40-45K |
1.97% |
3.27% |
60.35 |
|
| £45-50K |
1.39% |
2.48% |
56.05 |
|
| £50-55K |
1.00% |
1.90% |
52.39 |
|
| £55-60K |
0.73% |
1.47% |
49.22 |
|
| £60-65K |
0.53% |
1.15% |
46.46 |
|
| £65-70K |
0.40% |
0.91% |
44.04 |
|
| £70-75K |
0.30% |
0.72% |
41.89 |
|
| £75-80K |
0.23% |
0.57% |
39.98 |
|
| £80-85K |
0.18% |
0.46% |
38.26 |
|
| £85-90K |
0.14% |
0.37% |
36.72 |
|
| £90-95K |
0.11% |
0.31% |
35.32 |
|
| £95-100K |
0.09% |
0.25% |
34.04 |
|
| £100K + |
0.38% |
1.34% |
28.27 |
|
|
|

|


|
1992-1997
|
1997-2001
|
|
|
|
| Con |
-12.54% |
| Lab |
7.76% |
| LD |
-2.38% |
|
| Con |
2.74% |
| Lab |
-2.97% |
| LD |
3.53% |
|
|
 |
Rosie Winterton
Labour hold
|
| Con |
 |
8,035 |
23.70% |
| Lab |
 |
20,034 |
59.09% |
| LD |
 |
4,390 |
12.95% |
| Oth |
 |
1,443 |
4.26% |
| Maj |
 |
11,999 |
35.39% |
| Turn |
 |
33,902 |
52.09% |
|
|
 |
Rosie Winterton
Labour hold
|
| UK |
David Gordon |
926 |
2.73% |
| C |
Gary Meggitt |
8,035 |
23.70% |
| LD |
Michael Southcombe |
4,390 |
12.95% |
| SA |
Janet Terry |
517 |
1.52% |
| L |
Rosie Winterton |
20,034 |
59.09% |
|
Candidates representing 5 parties stood for election to this seat.
|
|
 |
Rosalie Winterton
Labour
|
| Con |
 |
9,105 |
20.96% |
| Lab |
 |
26,961 |
62.06% |
| LD |
 |
4,091 |
9.42% |
| Ref |
 |
1,273 |
2.93% |
| Oth |
 |
2,013 |
4.63% |
| Maj |
 |
17,856 |
41.10% |
| Turn |
 |
43,443 |
63.92% |
|
|
 |
|
Labour
|
| Con |
 |
17,113 |
33.50% |
| Lab |
 |
27,795 |
54.30% |
| LD |
 |
6,057 |
11.80% |
| Oth |
 |
184 |
0.40% |
| Maj |
 |
10,682 |
20.90% |
| Turn |
 |
51,149 |
73.93% |
|
|
 |
|

|

