|
Dorset Mid & North Poole
Liberal Democrat gain

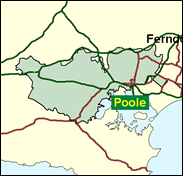
One of the Conservatives' narrow holds in 1997, the newly drawn seat of Mid Dorset and North Poole will again be a prime Liberal Democrat target this time. Much will depend on the tactical squeeze on the Labour vote now that it is clear that they have no chance in a seat put together in a rather piecemeal fashion, drawn from three different local authorities. In the 1999 local elections the Conservatives advanced both in the northern suburbs of the booming Poole, which comprise over 60pc of the seat, and in the more rural Dorset sections around Corfe Mullen and Wareham, and then took a 28pc lead in the Euro-election returns within this seat. Christopher Fraser is likely to increase his lead to four figures in the next General Election.

Christopher Fraser, a pinstriped Conservative and management consultant, won here in 1997 following a career as a local councillor in Hertfordshire. Born in 1962 and with three generations of family background in Dorset, he was educated at Harrow College (nothing to do with the school), specialises in Mandelson-baiting and backed Michael Howard for leader. He was PPS to Lord Strathclyde, the Tory leader in the House of Lords, for two years. The Liberal Democrats’ Annette Brooke, a leading member of Poole Council would like to think she has a chance. A former teacher and lecturer now running a family business involving rocks and minerals, she attended Romford County Technical School and LSE, but does not disclose her date of birth.
 |
| Wealthy Achievers, Suburban Areas |
22.95% |
14.99% |
153.08 |
|
| Affluent Greys, Rural Communities |
0.73% |
2.13% |
34.15 |
|
| Prosperous Pensioners, Retirement Areas |
8.28% |
2.49% |
333.14 |
|
| Affluent Executives, Family Areas |
16.10% |
4.43% |
363.89 |
|
| Well-Off Workers, Family Areas |
13.60% |
7.27% |
187.01 |
|
| Affluent Urbanites, Town & City Areas |
1.00% |
2.56% |
38.82 |
|
| Prosperous Professionals, Metropolitan Areas |
0.01% |
2.04% |
0.73 |
|
| Better-Off Executives, Inner City Areas |
0.00% |
3.94% |
0.00 |
|
| Comfortable Middle Agers, Mature Home Owning Areas |
13.51% |
13.04% |
103.61 |
|
| Skilled Workers, Home Owning Areas |
7.44% |
12.70% |
58.55 |
|
| New Home Owners, Mature Communities |
6.68% |
8.14% |
82.00 |
|
| White Collar Workers, Better-Off Multi Ethnic Areas |
0.65% |
4.02% |
16.15 |
|
| Older People, Less Prosperous Areas |
0.91% |
3.19% |
28.71 |
|
| Council Estate Residents, Better-Off Homes |
7.99% |
11.31% |
70.61 |
|
| Council Estate Residents, High Unemployment |
0.15% |
3.06% |
4.81 |
|
| Council Estate Residents, Greatest Hardship |
0.00% |
2.52% |
0.05 |
|
| People in Multi-Ethnic, Low-Income Areas |
0.00% |
2.10% |
0.00 |
|
| Unclassified |
0.00% |
0.06% |
0.00 |
|
|
 |
 |
 |
| £0-5K |
7.86% |
9.41% |
83.47 |
|
| £5-10K |
15.95% |
16.63% |
95.91 |
|
| £10-15K |
17.15% |
16.58% |
103.46 |
|
| £15-20K |
14.56% |
13.58% |
107.21 |
|
| £20-25K |
11.26% |
10.39% |
108.38 |
|
| £25-30K |
8.39% |
7.77% |
107.94 |
|
| £30-35K |
6.17% |
5.79% |
106.53 |
|
| £35-40K |
4.53% |
4.33% |
104.55 |
|
| £40-45K |
3.34% |
3.27% |
102.24 |
|
| £45-50K |
2.48% |
2.48% |
99.77 |
|
| £50-55K |
1.85% |
1.90% |
97.22 |
|
| £55-60K |
1.40% |
1.47% |
94.68 |
|
| £60-65K |
1.06% |
1.15% |
92.17 |
|
| £65-70K |
0.81% |
0.91% |
89.72 |
|
| £70-75K |
0.63% |
0.72% |
87.36 |
|
| £75-80K |
0.49% |
0.57% |
85.09 |
|
| £80-85K |
0.38% |
0.46% |
82.90 |
|
| £85-90K |
0.30% |
0.37% |
80.82 |
|
| £90-95K |
0.24% |
0.31% |
78.82 |
|
| £95-100K |
0.19% |
0.25% |
76.92 |
|
| £100K + |
0.90% |
1.34% |
66.65 |
|
|
|

|


|
1992-1997
|
1997-2001
|
|
|
|
| Con |
-9.43% |
| Lab |
3.90% |
| LD |
1.33% |
|
| Con |
0.45% |
| Lab |
-0.32% |
| LD |
2.67% |
|
|
 |
Annette Brooke
Liberal Democrat gain
|
| Con |
 |
17,974 |
41.11% |
| Lab |
 |
6,765 |
15.47% |
| LD |
 |
18,358 |
41.99% |
| Oth |
 |
621 |
1.42% |
| Maj |
 |
384 |
0.88% |
| Turn |
 |
43,718 |
65.57% |
|
|
 |
Annette Brooke
Liberal Democrat gain
|
| LD |
Annette Brooke |
18,358 |
41.99% |
| C |
Christopher Fraser |
17,974 |
41.11% |
| UK |
Jeff Mager |
621 |
1.42% |
| L |
James Selby-Bennett |
6,765 |
15.47% |
|
Candidates representing 4 parties stood for election to this seat.
|
|
 |
Christopher Fraser
Conservative
|
| Con |
 |
20,632 |
40.67% |
| Lab |
 |
8,014 |
15.80% |
| LD |
 |
19,951 |
39.33% |
| Ref |
 |
2,136 |
4.21% |
| Oth |
|
0 |
0.00% |
| Maj |
 |
681 |
1.34% |
| Turn |
 |
50,733 |
75.67% |
|
|
 |
|
Conservative
|
| Con |
 |
24,999 |
50.10% |
| Lab |
 |
5,959 |
11.90% |
| LD |
 |
18,945 |
38.00% |
| Oth |
|
0 |
0.00% |
| Maj |
 |
6,054 |
12.10% |
| Turn |
 |
49,903 |
76.97% |
|
|
 |
|

|

