|
Dorset North
Conservative hold

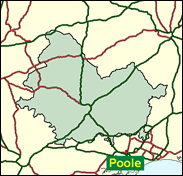
The Conservatives only just held on to several of their Dorset seats in 1997, including North, but they did manage to make this one of the only two counties, along with Surrey, where they won 100pc of the seats. They are probably just favourites to do so again, especially if they can turn the minds of the electorate towards the question of Britain's role with regard to Europe: they polled over 50pc of the vote in North Dorset in the 1999 Euro-elections compared with 15pc for their nearest challengers, the Liberal Democrats. It is uncertain whether this strategy will be affected here by the fact that the sitting MP, Robert Walter, is one of the few remaining pro-European moderates in the rump of the party left in the Commons after the landslide last time. North Dorset is typified by small independent old market towns like Shaftesbury, Blandford Forum, Gillingham and Wimborne Minster, each with a population of a little over 6,000. there are also over 80 villages. All this covers the dramatic scenery of Cranborne Chase, the Blackmore Vale and the chalk downs. The Conservatives took 16 seats on North Dorset council to the Liberal Democrats' 10 in 1999, and it sounds like the Tories should hold on again.

Robert Walter, a Conservative frontbencher as a spokesman for Wales, is one of the rare Clarke supporters in the 1997 intake. A banker and sheep farmer, born 1948 in Swansea, he attended Colston School Bristol, Lord Weymouth School Warminster and Aston University. He has quit the Carlton Club because it would not admit women, especially his girlfriend Barbara Nutt, and has introduced a Private Member’s Bill on the subject. Emily Gasson, seeking to turn the clock back to 1945 when the Liberals last won the seat, is a solicitor, born in 1970 and educated at Frensham Heights and at Durham University.
 |
| Wealthy Achievers, Suburban Areas |
23.86% |
14.99% |
159.14 |
|
| Affluent Greys, Rural Communities |
9.61% |
2.13% |
452.00 |
|
| Prosperous Pensioners, Retirement Areas |
11.39% |
2.49% |
458.01 |
|
| Affluent Executives, Family Areas |
3.86% |
4.43% |
87.26 |
|
| Well-Off Workers, Family Areas |
4.15% |
7.27% |
57.10 |
|
| Affluent Urbanites, Town & City Areas |
0.25% |
2.56% |
9.56 |
|
| Prosperous Professionals, Metropolitan Areas |
0.13% |
2.04% |
6.51 |
|
| Better-Off Executives, Inner City Areas |
0.44% |
3.94% |
11.18 |
|
| Comfortable Middle Agers, Mature Home Owning Areas |
28.77% |
13.04% |
220.67 |
|
| Skilled Workers, Home Owning Areas |
4.15% |
12.70% |
32.66 |
|
| New Home Owners, Mature Communities |
6.68% |
8.14% |
82.01 |
|
| White Collar Workers, Better-Off Multi Ethnic Areas |
0.91% |
4.02% |
22.73 |
|
| Older People, Less Prosperous Areas |
0.96% |
3.19% |
30.26 |
|
| Council Estate Residents, Better-Off Homes |
4.62% |
11.31% |
40.88 |
|
| Council Estate Residents, High Unemployment |
0.13% |
3.06% |
4.16 |
|
| Council Estate Residents, Greatest Hardship |
0.03% |
2.52% |
1.20 |
|
| People in Multi-Ethnic, Low-Income Areas |
0.00% |
2.10% |
0.00 |
|
| Unclassified |
0.05% |
0.06% |
77.99 |
|
|
 |
 |
 |
| £0-5K |
8.44% |
9.41% |
89.69 |
|
| £5-10K |
16.05% |
16.63% |
96.48 |
|
| £10-15K |
16.87% |
16.58% |
101.74 |
|
| £15-20K |
14.25% |
13.58% |
104.87 |
|
| £20-25K |
11.03% |
10.39% |
106.13 |
|
| £25-30K |
8.24% |
7.77% |
106.04 |
|
| £30-35K |
6.08% |
5.79% |
105.05 |
|
| £35-40K |
4.49% |
4.33% |
103.52 |
|
| £40-45K |
3.32% |
3.27% |
101.68 |
|
| £45-50K |
2.47% |
2.48% |
99.70 |
|
| £50-55K |
1.86% |
1.90% |
97.66 |
|
| £55-60K |
1.41% |
1.47% |
95.63 |
|
| £60-65K |
1.08% |
1.15% |
93.65 |
|
| £65-70K |
0.83% |
0.91% |
91.73 |
|
| £70-75K |
0.65% |
0.72% |
89.89 |
|
| £75-80K |
0.51% |
0.57% |
88.13 |
|
| £80-85K |
0.40% |
0.46% |
86.44 |
|
| £85-90K |
0.32% |
0.37% |
84.83 |
|
| £90-95K |
0.25% |
0.31% |
83.30 |
|
| £95-100K |
0.20% |
0.25% |
81.83 |
|
| £100K + |
0.99% |
1.34% |
73.70 |
|
|
|

|


|
1992-1997
|
1997-2001
|
|
|
|
| Con |
-12.20% |
| Lab |
4.23% |
| LD |
1.67% |
|
| Con |
2.37% |
| Lab |
0.92% |
| LD |
-0.35% |
|
|
 |
Robert Walter
Conservative hold
|
| Con |
 |
22,314 |
46.66% |
| Lab |
 |
5,334 |
11.15% |
| LD |
 |
18,517 |
38.72% |
| Oth |
 |
1,656 |
3.46% |
| Maj |
 |
3,797 |
7.94% |
| Turn |
 |
47,821 |
66.29% |
|
|
 |
Robert Walter
Conservative hold
|
| I |
Cora Bone |
246 |
0.51% |
| Ex |
Joseph Duthie |
391 |
0.82% |
| LD |
Emily Gasson |
18,517 |
38.72% |
| UK |
Peter Jenkins |
1,019 |
2.13% |
| C |
Robert Walter |
22,314 |
46.66% |
| L |
Mark Wareham |
5,334 |
11.15% |
|
Candidates representing 6 parties stood for election to this seat.
|
|
 |
Robert Walter
Conservative
|
| Con |
 |
23,294 |
44.30% |
| Lab |
 |
5,380 |
10.23% |
| LD |
 |
20,548 |
39.07% |
| Ref |
 |
2,564 |
4.88% |
| Oth |
 |
801 |
1.52% |
| Maj |
 |
2,746 |
5.22% |
| Turn |
 |
52,587 |
76.30% |
|
|
 |
|
Conservative
|
| Con |
 |
29,855 |
56.50% |
| Lab |
 |
3,195 |
6.00% |
| LD |
 |
19,784 |
37.40% |
| Oth |
|
0 |
0.00% |
| Maj |
 |
10,071 |
19.10% |
| Turn |
 |
52,834 |
81.38% |
|
|
 |
|

|

