|
Dorset South
Labour gain

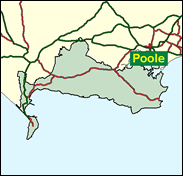
Labour's closest effort to yet another gain in the 1997 General Election, it would truly be a shock if they were to go the extra inch and actually take South Dorset. It would show just what a deep pit of trouble the party which has every claim to be the electoral champions of the twentieth century would be in, as the 21st starts. The Labour strength is clearly concentrated in Weymouth and Portland where te Conservatives did not win a single seat in the 1997 county council elections on the same day as they were (just) winning South Dorset, rather than the Purbeck section around Swanage (David Mellor's home town, believe it or not). Labour lost three of the five seats they were defending even in Weymouth and Portland in the council elections in May 2000, so it does not look like Labour will be increasing their overall majority - at least not by gaining Dorset South.

Ian Bruce, a self-made, rightwing, Essex-born businessman in a seat once the property of the Cecils, was elected here for the Tories in 1987. He was born in 1947 and educated at technical schools and technical colleges in Chelmsford, and rose from Marconi electrics apprentice, through work study manager, to factory manager, to running his own employment agency. His reputation is as a techno-nerd who complains about clogged Dorset roads. Bruce is challenged again by Jim Knight, Labour's candidate in 1997 who was born in 1965 and educated at Eltham College in southeast London and Fitzwilliam College, Cambridge. Bruce is challenged again by Labour's candidate, Jim Knight, a publisher.
 |
| Wealthy Achievers, Suburban Areas |
16.61% |
14.99% |
110.77 |
|
| Affluent Greys, Rural Communities |
7.43% |
2.13% |
349.37 |
|
| Prosperous Pensioners, Retirement Areas |
8.50% |
2.49% |
342.02 |
|
| Affluent Executives, Family Areas |
2.57% |
4.43% |
58.00 |
|
| Well-Off Workers, Family Areas |
2.47% |
7.27% |
34.01 |
|
| Affluent Urbanites, Town & City Areas |
0.85% |
2.56% |
33.07 |
|
| Prosperous Professionals, Metropolitan Areas |
0.00% |
2.04% |
0.00 |
|
| Better-Off Executives, Inner City Areas |
4.28% |
3.94% |
108.49 |
|
| Comfortable Middle Agers, Mature Home Owning Areas |
18.19% |
13.04% |
139.48 |
|
| Skilled Workers, Home Owning Areas |
11.30% |
12.70% |
88.96 |
|
| New Home Owners, Mature Communities |
10.98% |
8.14% |
134.78 |
|
| White Collar Workers, Better-Off Multi Ethnic Areas |
6.26% |
4.02% |
155.69 |
|
| Older People, Less Prosperous Areas |
3.87% |
3.19% |
121.39 |
|
| Council Estate Residents, Better-Off Homes |
5.25% |
11.31% |
46.44 |
|
| Council Estate Residents, High Unemployment |
0.08% |
3.06% |
2.71 |
|
| Council Estate Residents, Greatest Hardship |
1.37% |
2.52% |
54.25 |
|
| People in Multi-Ethnic, Low-Income Areas |
0.00% |
2.10% |
0.00 |
|
| Unclassified |
0.00% |
0.06% |
0.00 |
|
|
 |
 |
 |
| £0-5K |
10.02% |
9.41% |
106.49 |
|
| £5-10K |
19.43% |
16.63% |
116.80 |
|
| £10-15K |
19.25% |
16.58% |
116.12 |
|
| £15-20K |
15.05% |
13.58% |
110.77 |
|
| £20-25K |
10.77% |
10.39% |
103.61 |
|
| £25-30K |
7.46% |
7.77% |
96.01 |
|
| £30-35K |
5.14% |
5.79% |
88.66 |
|
| £35-40K |
3.55% |
4.33% |
81.84 |
|
| £40-45K |
2.47% |
3.27% |
75.67 |
|
| £45-50K |
1.74% |
2.48% |
70.14 |
|
| £50-55K |
1.24% |
1.90% |
65.22 |
|
| £55-60K |
0.90% |
1.47% |
60.85 |
|
| £60-65K |
0.66% |
1.15% |
56.96 |
|
| £65-70K |
0.48% |
0.91% |
53.49 |
|
| £70-75K |
0.36% |
0.72% |
50.40 |
|
| £75-80K |
0.27% |
0.57% |
47.62 |
|
| £80-85K |
0.21% |
0.46% |
45.13 |
|
| £85-90K |
0.16% |
0.37% |
42.87 |
|
| £90-95K |
0.12% |
0.31% |
40.82 |
|
| £95-100K |
0.10% |
0.25% |
38.96 |
|
| £100K + |
0.41% |
1.34% |
30.55 |
|
|
|

|


|
1992-1997
|
1997-2001
|
|
|
|
| Con |
-14.80% |
| Lab |
15.14% |
| LD |
-6.40% |
|
| Con |
5.52% |
| Lab |
6.02% |
| LD |
-5.80% |
|
|
 |
Jim Knight
Labour gain
|
| Con |
 |
18,874 |
41.62% |
| Lab |
 |
19,027 |
41.96% |
| LD |
 |
6,531 |
14.40% |
| Oth |
 |
913 |
2.01% |
| Maj |
 |
153 |
0.34% |
| Turn |
 |
45,345 |
65.50% |
|
|
 |
Jim Knight
Labour gain
|
| C |
Ian Cameron-Bruce |
18,874 |
41.62% |
| LD |
Andrew Canning |
6,531 |
14.40% |
| L |
Jim Knight |
19,027 |
41.96% |
| UK |
Laurence Moss |
913 |
2.01% |
|
Candidates representing 4 parties stood for election to this seat.
|
|
 |
Ian Bruce
Conservative
|
| Con |
 |
17,755 |
36.10% |
| Lab |
 |
17,678 |
35.94% |
| LD |
 |
9,936 |
20.20% |
| Ref |
 |
2,791 |
5.67% |
| Oth |
 |
1,022 |
2.08% |
| Maj |
 |
77 |
0.16% |
| Turn |
 |
49,182 |
74.16% |
|
|
 |
|
Conservative
|
| Con |
 |
26,405 |
50.90% |
| Lab |
 |
10,805 |
20.80% |
| LD |
 |
13,788 |
26.60% |
| Oth |
 |
864 |
1.70% |
| Maj |
 |
12,617 |
24.30% |
| Turn |
 |
51,862 |
76.55% |
|
|
 |
|

|

