|
Dorset West
Conservative hold

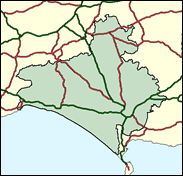
Despite being next door to Paddy Ashdown's Yeovil, and although the Liberal Democrats cut the Conservative majority to under 2,000 in 1997, the Tory Oliver Letwin is favourite to hold on next time. It was a close run thing in 1997, for the Conservative vote slipped by 10pc, while it was not so much the Lib Dems as Labour who advanced. If the tactical voting rules had applied, Letwin would not have entered the Commons to start what could well be a bright career, and instead the Sherborne based Robin Legg would have joined nearly fifty colleagues in the largets Liberal contingent in the House since 1929. Labour's strength is Bridport, a rather raffish place said to be a centre of smuggling, so perhaps rules do not apply in parts of west Dorset. Letwin must hope that this continues to be the case, in this rather amusing part of the workld, the home of the Piddle valley and the Cerne Abbas Giant, locations which bring a smile to the face of even those who have not been partaking of the local cider.

Oliver Letwin, Shadow Chief Secretary within three years of reaching the Commons in 1997, is one of the most respected of the Tory rightwing intellectuals, a rare Rolls Royce mind in politics. He was born in 1956, educated at Eton, Trinity College Cambridge (with a doctorate in the Philosophy of Education) and ran the international privatisation unit at Rothschilds. A sensitive Hampstead Jewish intellectual, now wading through Wessex mud in green wellies, he is an unremitting opponent of Euro federalism and followed Redwood all the way into the last ditch with Clarke in 1997. The Liberal Democrats 43-year-old Simon Green is an agronomist and lecturer in agriculture as well as a working sheep farmer with a background of a research biochemist with Maff. Green not only by name, he is a campaigner on the environment and on regenerating the rural economy, with a high profile in the local press. His wellies are conspicuously more mud-splattered than Oliver Letwin's.
 |
| Wealthy Achievers, Suburban Areas |
15.57% |
14.99% |
103.83 |
|
| Affluent Greys, Rural Communities |
18.39% |
2.13% |
864.75 |
|
| Prosperous Pensioners, Retirement Areas |
17.16% |
2.49% |
690.41 |
|
| Affluent Executives, Family Areas |
1.25% |
4.43% |
28.35 |
|
| Well-Off Workers, Family Areas |
1.69% |
7.27% |
23.26 |
|
| Affluent Urbanites, Town & City Areas |
0.23% |
2.56% |
9.13 |
|
| Prosperous Professionals, Metropolitan Areas |
0.00% |
2.04% |
0.00 |
|
| Better-Off Executives, Inner City Areas |
0.41% |
3.94% |
10.45 |
|
| Comfortable Middle Agers, Mature Home Owning Areas |
17.99% |
13.04% |
137.97 |
|
| Skilled Workers, Home Owning Areas |
5.81% |
12.70% |
45.75 |
|
| New Home Owners, Mature Communities |
12.16% |
8.14% |
149.37 |
|
| White Collar Workers, Better-Off Multi Ethnic Areas |
3.09% |
4.02% |
76.73 |
|
| Older People, Less Prosperous Areas |
3.77% |
3.19% |
118.29 |
|
| Council Estate Residents, Better-Off Homes |
2.09% |
11.31% |
18.45 |
|
| Council Estate Residents, High Unemployment |
0.34% |
3.06% |
10.96 |
|
| Council Estate Residents, Greatest Hardship |
0.00% |
2.52% |
0.00 |
|
| People in Multi-Ethnic, Low-Income Areas |
0.00% |
2.10% |
0.00 |
|
| Unclassified |
0.05% |
0.06% |
77.68 |
|
|
 |
 |
 |
| £0-5K |
9.88% |
9.41% |
104.97 |
|
| £5-10K |
18.65% |
16.63% |
112.14 |
|
| £10-15K |
18.66% |
16.58% |
112.57 |
|
| £15-20K |
14.82% |
13.58% |
109.11 |
|
| £20-25K |
10.79% |
10.39% |
103.80 |
|
| £25-30K |
7.61% |
7.77% |
97.85 |
|
| £30-35K |
5.32% |
5.79% |
91.89 |
|
| £35-40K |
3.74% |
4.33% |
86.23 |
|
| £40-45K |
2.64% |
3.27% |
81.00 |
|
| £45-50K |
1.89% |
2.48% |
76.23 |
|
| £50-55K |
1.37% |
1.90% |
71.91 |
|
| £55-60K |
1.00% |
1.47% |
68.00 |
|
| £60-65K |
0.74% |
1.15% |
64.48 |
|
| £65-70K |
0.56% |
0.91% |
61.30 |
|
| £70-75K |
0.42% |
0.72% |
58.41 |
|
| £75-80K |
0.32% |
0.57% |
55.80 |
|
| £80-85K |
0.25% |
0.46% |
53.42 |
|
| £85-90K |
0.19% |
0.37% |
51.24 |
|
| £90-95K |
0.15% |
0.31% |
49.26 |
|
| £95-100K |
0.12% |
0.25% |
47.43 |
|
| £100K + |
0.52% |
1.34% |
38.99 |
|
|
|

|


|
1992-1997
|
1997-2001
|
|
|
|
| Con |
-9.75% |
| Lab |
4.72% |
| LD |
1.51% |
|
| Con |
3.49% |
| Lab |
-4.14% |
| LD |
4.07% |
|
|
 |
Oliver Letwin
Conservative hold
|
| Con |
 |
22,126 |
44.63% |
| Lab |
 |
6,733 |
13.58% |
| LD |
 |
20,712 |
41.78% |
| Oth |
|
0 |
0.00% |
| Maj |
 |
1,414 |
2.85% |
| Turn |
 |
49,571 |
66.97% |
|
|
 |
Oliver Letwin
Conservative hold
|
| LD |
Simon Green |
20,712 |
41.78% |
| L |
Richard Hyde |
6,733 |
13.58% |
| C |
Oliver Letwin |
22,126 |
44.63% |
|
Candidates representing 3 parties stood for election to this seat.
|
|
 |
Oliver Letwin
Conservative
|
| Con |
 |
22,036 |
41.15% |
| Lab |
 |
9,491 |
17.72% |
| LD |
 |
20,196 |
37.71% |
| Ref |
|
0 |
0.00% |
| Oth |
 |
1,829 |
3.42% |
| Maj |
 |
1,840 |
3.44% |
| Turn |
 |
53,552 |
76.10% |
|
|
 |
|
Conservative
|
| Con |
 |
27,766 |
50.90% |
| Lab |
 |
7,082 |
13.00% |
| LD |
 |
19,755 |
36.20% |
| Oth |
|
0 |
0.00% |
| Maj |
 |
8,011 |
14.70% |
| Turn |
 |
54,603 |
81.16% |
|
|
 |
|

|

