|
Aberdeen Central
Labour hold

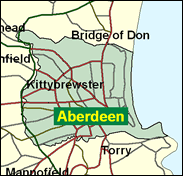
The heart of Scotland's third largest city, containing the commercial and business centre of a conurbation to which the discovery of North Sea oil brought so much change, Central includes more territory from the solidly Labour north side of Aberdeen than the more middle-class south. In its first contest in 1997 Frank Doran won by a clear 10,000 votes (30pc of those cast) over an evenly three-way divided opposition. Aberdeen Central remained safely in Labour hands in the May 1999 Scottish Parliament elections (one-member constituency sections), unlike North (marginal with SNP) and South (where the Liberal Democrats won), and it now looks like the party's one true banker in the city.

Frank Doran won this seat in 1997, having represented Aberdeen South from 1987 to 1992 and been the only Labour MP (apart from by-election entrants) to be beaten in 1997. A Dundee-born (1949) solicitor, educated at Leith Academy and Dundee University, he is a former member, with his partner of ten years, Joan Ruddock MP, of the Left-wing Supper Club, which resisted the Gulf War. Although an energy spokesman in Opposition, partly whilst Tony Blair was chief energy spokesman, he received no government post under Blair, other than PPS to Ian McCartney, a sidelining also experienced by Joan Ruddock who was dropped as a minister after only a year. His selection in 1995 for Aberdeen Central was locally divisive, ending as it did the parliamentary career of the popular MP of 25 years, Bob Hughes.

 |
| Wealthy Achievers, Suburban Areas |
3.48% |
14.99% |
23.19 |
|
| Affluent Greys, Rural Communities |
0.00% |
2.13% |
0.00 |
|
| Prosperous Pensioners, Retirement Areas |
0.59% |
2.49% |
23.93 |
|
| Affluent Executives, Family Areas |
2.08% |
4.43% |
46.99 |
|
| Well-Off Workers, Family Areas |
0.47% |
7.27% |
6.40 |
|
| Affluent Urbanites, Town & City Areas |
8.26% |
2.56% |
322.16 |
|
| Prosperous Professionals, Metropolitan Areas |
5.33% |
2.04% |
260.99 |
|
| Better-Off Executives, Inner City Areas |
34.65% |
3.94% |
878.63 |
|
| Comfortable Middle Agers, Mature Home Owning Areas |
1.40% |
13.04% |
10.74 |
|
| Skilled Workers, Home Owning Areas |
1.07% |
12.70% |
8.44 |
|
| New Home Owners, Mature Communities |
2.10% |
8.14% |
25.75 |
|
| White Collar Workers, Better-Off Multi Ethnic Areas |
2.57% |
4.02% |
63.92 |
|
| Older People, Less Prosperous Areas |
2.46% |
3.19% |
77.19 |
|
| Council Estate Residents, Better-Off Homes |
8.28% |
11.31% |
73.17 |
|
| Council Estate Residents, High Unemployment |
21.04% |
3.06% |
687.08 |
|
| Council Estate Residents, Greatest Hardship |
5.19% |
2.52% |
205.99 |
|
| People in Multi-Ethnic, Low-Income Areas |
1.04% |
2.10% |
49.58 |
|
| Unclassified |
0.00% |
0.06% |
0.00 |
|
|
 |
 |
 |
| £0-5K |
10.33% |
9.41% |
109.69 |
|
| £5-10K |
17.73% |
16.63% |
106.60 |
|
| £10-15K |
17.20% |
16.58% |
103.73 |
|
| £15-20K |
13.72% |
13.58% |
101.02 |
|
| £20-25K |
10.25% |
10.39% |
98.62 |
|
| £25-30K |
7.51% |
7.77% |
96.56 |
|
| £30-35K |
5.49% |
5.79% |
94.81 |
|
| £35-40K |
4.04% |
4.33% |
93.34 |
|
| £40-45K |
3.01% |
3.27% |
92.12 |
|
| £45-50K |
2.26% |
2.48% |
91.11 |
|
| £50-55K |
1.72% |
1.90% |
90.28 |
|
| £55-60K |
1.32% |
1.47% |
89.61 |
|
| £60-65K |
1.03% |
1.15% |
89.07 |
|
| £65-70K |
0.80% |
0.91% |
88.64 |
|
| £70-75K |
0.64% |
0.72% |
88.31 |
|
| £75-80K |
0.51% |
0.57% |
88.05 |
|
| £80-85K |
0.41% |
0.46% |
87.86 |
|
| £85-90K |
0.33% |
0.37% |
87.71 |
|
| £90-95K |
0.27% |
0.31% |
87.62 |
|
| £95-100K |
0.22% |
0.25% |
87.55 |
|
| £100K + |
1.18% |
1.34% |
87.66 |
|
|
|

|


|
1992-1997
|
1997-2001
|
|
|
|
| Con |
-9.30% |
| Lab |
6.72% |
| LD |
2.64% |
| SNP |
-1.41% |
|
| Con |
-5.27% |
| Lab |
-4.32% |
| LD |
3.97% |
| SNP |
4.16% |
|
|
 |
Frank Doran
Labour hold
|
| Con |
 |
3,761 |
14.23% |
| Lab |
 |
12,025 |
45.50% |
| LD |
 |
4,547 |
17.20% |
| SNP |
 |
5,379 |
20.35% |
| Oth |
 |
717 |
2.71% |
| Maj |
 |
6,646 |
25.15% |
| Turn |
 |
26,429 |
52.75% |
|
|
 |
Frank Doran
Labour hold
|
| LD |
Eleanor Anderson |
4,547 |
17.20% |
| SSP |
Andy Cumbers |
717 |
2.71% |
| L |
Frank Doran |
12,025 |
45.50% |
| SNP |
Wayne Gault |
5,379 |
20.35% |
| C |
Stewart Whyte |
3,761 |
14.23% |
|
Candidates representing 5 parties stood for election to this seat.
|
|
 |
Frank Doran
Labour
|
| Con |
 |
6,944 |
19.50% |
| Lab |
 |
17,745 |
49.82% |
| LD |
 |
4,714 |
13.24% |
| SNP |
 |
5,767 |
16.19% |
| Ref |
 |
446 |
1.25% |
| Oth |
|
0 |
0.00% |
| Maj |
 |
10,801 |
30.33% |
| Turn |
 |
35,616 |
65.64% |
|
|
 |
|
Labour
|
| Con |
 |
10,872 |
28.80% |
| Lab |
 |
16,269 |
43.10% |
| LD |
 |
3,985 |
10.60% |
| SNP |
 |
6,636 |
17.60% |
| Oth |
|
0 |
0.00% |
| Maj |
 |
5,397 |
14.30% |
| Turn |
 |
37,762 |
67.57% |
|
|
 |
|

|

