|
Ashton under Lyne
Labour hold

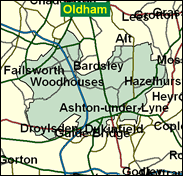
Safely Labour for at least six decades, the north Tameside constituency of Ashton under Lyne, which also includes Droylsden and Failsworth, is being vacated by Labour's oldest MP Robert Sheldon (born in 1923), who achieved his highest majority ever, 23,000, in 1997. This ex-textile industry seat has virtually no significant pockets of opposition for the foreseeable future.

In place of Labour's retiring Bob Sheldon, comes the unexpected 54 year old Oldham councillor David Heyes, who beat Tameside councillor Kieron Quinn, who had supposedly the endorsement of the Millbank machine. Committed to sustaining Labour's trade union link and, as a former NALGO organiser, "directly-employed public sector workers", David Heyes, a CAB manager since 1995 and vice-chairman of Ashton CLP, was reportedly 'stunned' by his selection by seven votes. Educated at Blackley Technical High School and the OU, he will inherit the seat in June with a somewhat larger majority than 7, but comes too late to emulate Bob Sheldon's 37-year incumbency.

 |
| Wealthy Achievers, Suburban Areas |
1.31% |
14.99% |
8.72 |
|
| Affluent Greys, Rural Communities |
0.00% |
2.13% |
0.00 |
|
| Prosperous Pensioners, Retirement Areas |
0.00% |
2.49% |
0.00 |
|
| Affluent Executives, Family Areas |
4.18% |
4.43% |
94.49 |
|
| Well-Off Workers, Family Areas |
7.07% |
7.27% |
97.19 |
|
| Affluent Urbanites, Town & City Areas |
0.00% |
2.56% |
0.00 |
|
| Prosperous Professionals, Metropolitan Areas |
0.00% |
2.04% |
0.00 |
|
| Better-Off Executives, Inner City Areas |
0.42% |
3.94% |
10.54 |
|
| Comfortable Middle Agers, Mature Home Owning Areas |
4.08% |
13.04% |
31.31 |
|
| Skilled Workers, Home Owning Areas |
43.70% |
12.70% |
344.03 |
|
| New Home Owners, Mature Communities |
8.13% |
8.14% |
99.84 |
|
| White Collar Workers, Better-Off Multi Ethnic Areas |
0.12% |
4.02% |
3.10 |
|
| Older People, Less Prosperous Areas |
6.81% |
3.19% |
213.68 |
|
| Council Estate Residents, Better-Off Homes |
16.67% |
11.31% |
147.39 |
|
| Council Estate Residents, High Unemployment |
3.53% |
3.06% |
115.13 |
|
| Council Estate Residents, Greatest Hardship |
3.98% |
2.52% |
158.21 |
|
| People in Multi-Ethnic, Low-Income Areas |
0.00% |
2.10% |
0.00 |
|
| Unclassified |
0.00% |
0.06% |
0.00 |
|
|
 |
|
|
| £0-5K |
11.45% |
9.41% |
121.67 |
|
| £5-10K |
20.40% |
16.63% |
122.67 |
|
| £10-15K |
19.37% |
16.58% |
116.84 |
|
| £15-20K |
14.68% |
13.58% |
108.10 |
|
| £20-25K |
10.27% |
10.39% |
98.78 |
|
| £25-30K |
7.00% |
7.77% |
89.98 |
|
| £30-35K |
4.76% |
5.79% |
82.10 |
|
| £35-40K |
3.26% |
4.33% |
75.21 |
|
| £40-45K |
2.26% |
3.27% |
69.25 |
|
| £45-50K |
1.59% |
2.48% |
64.10 |
|
| £50-55K |
1.14% |
1.90% |
59.64 |
|
| £55-60K |
0.82% |
1.47% |
55.76 |
|
| £60-65K |
0.60% |
1.15% |
52.36 |
|
| £65-70K |
0.45% |
0.91% |
49.38 |
|
| £70-75K |
0.34% |
0.72% |
46.74 |
|
| £75-80K |
0.26% |
0.57% |
44.38 |
|
| £80-85K |
0.20% |
0.46% |
42.27 |
|
| £85-90K |
0.15% |
0.37% |
40.37 |
|
| £90-95K |
0.12% |
0.31% |
38.65 |
|
| £95-100K |
0.09% |
0.25% |
37.09 |
|
| £100K + |
0.40% |
1.34% |
29.93 |
|
|
|
|


|
1992-1997
|
1997-2001
|
|
|
|
| Con |
-9.76% |
| Lab |
10.51% |
| LD |
-2.16% |
|
| Con |
0.14% |
| Lab |
-5.05% |
| LD |
2.11% |
|
|
|
David Heyes
Labour hold
|
| Con |
 |
6,822 |
19.08% |
| Lab |
 |
22,340 |
62.47% |
| LD |
 |
4,237 |
11.85% |
| Oth |
 |
2,365 |
6.61% |
| Maj |
 |
15,518 |
43.39% |
| Turn |
|
35,764 |
49.11% |
|
|
|
David Heyes
Labour hold
|
| C |
Tim Charlesworth |
6,822 |
19.08% |
| LD |
Kate Fletcher |
4,237 |
11.85% |
| LCA |
Mark Henderson |
0 |
0.00% |
| L |
David Heyes |
22,340 |
62.47% |
| G |
Nigel Rolland |
748 |
2.09% |
| BNP |
Roger Woods |
1,617 |
4.52% |
|
Candidates representing 6 parties stood for election to this seat.
|
|
|
Robert Sheldon
Labour
|
| Con |
|
8,954 |
18.94% |
| Lab |
|
31,919 |
67.51% |
| LD |
|
4,603 |
9.74% |
| Ref |
 |
1,346 |
2.85% |
| Oth |
|
458 |
0.97% |
| Maj |
|
22,965 |
48.57% |
| Turn |
|
47,280 |
65.48% |
|
|
|
|
Labour
|
| Con |
|
15,706 |
28.70% |
| Lab |
|
31,138 |
57.00% |
| LD |
|
6,519 |
11.90% |
| Oth |
|
1,271 |
2.30% |
| Maj |
|
15,432 |
28.20% |
| Turn |
|
54,634 |
73.28% |
|
|
|
|
|