|
Dover
Labour hold

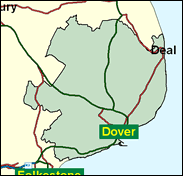
Despite its problems as a logical first port of call for asylum seekers, topical within this Parliament, Dover seems very unlikely to return to the Conservative allegiance in the near future. Although the refugees do not themselves have votes, of course, the overall social and economic changes affecting so many seaside towns are acting in Labour's long-term favour here, as elsewhere. Besides the working class and depressed elements of Dover itself, the seat contains the remnants of the remote Kent coalfield in Aylesham, a most surprising discovery in rural Kent, a village which in 1999 gave 93pc of its vote to Labour and 7pc to the Conserrvatives in a most one-sided straight fight, and the northern parts of Deal. This actually has the potential to be a safe Labour bastion in the far south east corner of the land.

Stocky, bearded Welshman Gwyn Prosser has had a difficult job as MP for Dover since 1997, dealing with the populist issue of illegal immigration and asylum seeking. Born 1943 in Swansea where he attended technical school and technical college, he was a marine engineer, eventually on local Sealink ferries. He has fought against undermanning of the ferries, opposed the rival Channel Tunnel, and protested about the problems of ex-miners and about joblessness on the defunct Kent coalfield.
 |
| Wealthy Achievers, Suburban Areas |
16.73% |
14.99% |
111.55 |
|
| Affluent Greys, Rural Communities |
0.66% |
2.13% |
31.07 |
|
| Prosperous Pensioners, Retirement Areas |
3.02% |
2.49% |
121.35 |
|
| Affluent Executives, Family Areas |
1.51% |
4.43% |
34.13 |
|
| Well-Off Workers, Family Areas |
4.86% |
7.27% |
66.82 |
|
| Affluent Urbanites, Town & City Areas |
0.43% |
2.56% |
16.85 |
|
| Prosperous Professionals, Metropolitan Areas |
0.00% |
2.04% |
0.00 |
|
| Better-Off Executives, Inner City Areas |
4.27% |
3.94% |
108.21 |
|
| Comfortable Middle Agers, Mature Home Owning Areas |
18.49% |
13.04% |
141.81 |
|
| Skilled Workers, Home Owning Areas |
19.58% |
12.70% |
154.14 |
|
| New Home Owners, Mature Communities |
8.86% |
8.14% |
108.78 |
|
| White Collar Workers, Better-Off Multi Ethnic Areas |
4.52% |
4.02% |
112.44 |
|
| Older People, Less Prosperous Areas |
3.23% |
3.19% |
101.40 |
|
| Council Estate Residents, Better-Off Homes |
11.99% |
11.31% |
106.00 |
|
| Council Estate Residents, High Unemployment |
0.88% |
3.06% |
28.66 |
|
| Council Estate Residents, Greatest Hardship |
0.90% |
2.52% |
35.88 |
|
| People in Multi-Ethnic, Low-Income Areas |
0.02% |
2.10% |
0.99 |
|
| Unclassified |
0.06% |
0.06% |
88.30 |
|
|
 |
 |
 |
| £0-5K |
10.32% |
9.41% |
109.64 |
|
| £5-10K |
18.97% |
16.63% |
114.04 |
|
| £10-15K |
18.50% |
16.58% |
111.58 |
|
| £15-20K |
14.51% |
13.58% |
106.85 |
|
| £20-25K |
10.55% |
10.39% |
101.47 |
|
| £25-30K |
7.47% |
7.77% |
96.08 |
|
| £30-35K |
5.27% |
5.79% |
90.94 |
|
| £35-40K |
3.73% |
4.33% |
86.13 |
|
| £40-45K |
2.67% |
3.27% |
81.69 |
|
| £45-50K |
1.93% |
2.48% |
77.59 |
|
| £50-55K |
1.41% |
1.90% |
73.83 |
|
| £55-60K |
1.04% |
1.47% |
70.39 |
|
| £60-65K |
0.77% |
1.15% |
67.22 |
|
| £65-70K |
0.58% |
0.91% |
64.31 |
|
| £70-75K |
0.44% |
0.72% |
61.64 |
|
| £75-80K |
0.34% |
0.57% |
59.17 |
|
| £80-85K |
0.26% |
0.46% |
56.90 |
|
| £85-90K |
0.21% |
0.37% |
54.80 |
|
| £90-95K |
0.16% |
0.31% |
52.85 |
|
| £95-100K |
0.13% |
0.25% |
51.04 |
|
| £100K + |
0.57% |
1.34% |
42.27 |
|
|
|

|


|
1992-1997
|
1997-2001
|
|
|
|
| Con |
-11.27% |
| Lab |
11.89% |
| LD |
-2.86% |
|
| Con |
4.41% |
| Lab |
-5.69% |
| LD |
3.48% |
|
|
 |
Gwyn Prosser
Labour hold
|
| Con |
 |
16,744 |
37.24% |
| Lab |
 |
21,943 |
48.81% |
| LD |
 |
5,131 |
11.41% |
| Oth |
 |
1,142 |
2.54% |
| Maj |
 |
5,199 |
11.56% |
| Turn |
 |
44,960 |
65.14% |
|
|
 |
Gwyn Prosser
Labour hold
|
| LD |
Antony Hook |
5,131 |
11.41% |
| L |
Gwyn Prosser |
21,943 |
48.81% |
| C |
Paul Prosser |
16,744 |
37.24% |
| UK |
Lee Speakman |
1,142 |
2.54% |
|
Candidates representing 4 parties stood for election to this seat.
|
|
 |
Gwyn Prosser
Labour gain
|
| Con |
 |
17,796 |
32.83% |
| Lab |
 |
29,535 |
54.49% |
| LD |
 |
4,302 |
7.94% |
| Ref |
 |
2,124 |
3.92% |
| Oth |
 |
443 |
0.82% |
| Maj |
 |
11,739 |
21.66% |
| Turn |
 |
54,200 |
78.93% |
|
|
 |
|
Conservative
|
| Con |
 |
25,443 |
44.10% |
| Lab |
 |
24,583 |
42.60% |
| LD |
 |
6,234 |
10.80% |
| Oth |
 |
1,422 |
2.50% |
| Maj |
 |
860 |
1.50% |
| Turn |
 |
57,682 |
82.82% |
|
|
 |
|

|

