|
Dudley North
Labour hold

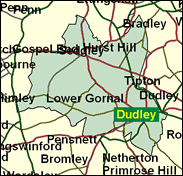
Slightly the less safe of the two Dudley divisions on the western edge of the West Midlands conurbation, the seat actually splits between Labour and Conservative on east - west lines. The governing party's strongest areas are further towards the heart of the population mass in Dudley itself and Coseley, but the Conservatives are fighting back in Sedgley, an old market town on the northwestern fringe of the countryside. There were ructions about candidature before the 1997 General Election, with Charles Falconer, one of "Tony's legal cronies" originally scheduled to be shoehorned in at the last minute in place of the veteran John Gilbert, who not only went to the Lords but also initially entered the government as Minister for Defence Procurement. Then on Falconer's withdrawal (his children went to private schools) an even later substitute was found in Ross Cranston. All these shenanigans probably helped to attract a Socialist Labour party candidate, who got 2,000 votes and kept the Labour share increase down to under 6pc, one of their worst in the country. As a consequence the seat still creeps into lists of marginals. In May 2000 as in other parts of the West Midlands Labour did very badly in the borough elections, on a terrible turnout except in Sedgley, and were behind the Tory candidates overall. One imagines this will not occur in a General Election, but nothing should be taken for granted.

Ross Cranston, one of the few Australians in British politics, came from nowhere (or at least the LSE) in 1997, as a last minute alternative to Charles Falconer, who was supposed to be shood-in to become Solicitor General, until his children's private schooling was exposed. Within a year, through his own shoo-in on an NEC-imposed shortlist, Cranston was himself Solicitor General. A dry, uncharismatic academic Blairite, he was born 1948 in Brisbane and educated at the Universities of Queensland, Harvard and Oxford.
 |
| Wealthy Achievers, Suburban Areas |
8.15% |
14.99% |
54.36 |
|
| Affluent Greys, Rural Communities |
0.00% |
2.13% |
0.00 |
|
| Prosperous Pensioners, Retirement Areas |
0.22% |
2.49% |
8.77 |
|
| Affluent Executives, Family Areas |
4.79% |
4.43% |
108.17 |
|
| Well-Off Workers, Family Areas |
6.63% |
7.27% |
91.09 |
|
| Affluent Urbanites, Town & City Areas |
0.00% |
2.56% |
0.00 |
|
| Prosperous Professionals, Metropolitan Areas |
0.00% |
2.04% |
0.00 |
|
| Better-Off Executives, Inner City Areas |
0.67% |
3.94% |
17.05 |
|
| Comfortable Middle Agers, Mature Home Owning Areas |
11.18% |
13.04% |
85.71 |
|
| Skilled Workers, Home Owning Areas |
16.63% |
12.70% |
130.88 |
|
| New Home Owners, Mature Communities |
19.03% |
8.14% |
233.72 |
|
| White Collar Workers, Better-Off Multi Ethnic Areas |
0.00% |
4.02% |
0.00 |
|
| Older People, Less Prosperous Areas |
5.27% |
3.19% |
165.50 |
|
| Council Estate Residents, Better-Off Homes |
20.33% |
11.31% |
179.71 |
|
| Council Estate Residents, High Unemployment |
1.24% |
3.06% |
40.54 |
|
| Council Estate Residents, Greatest Hardship |
4.85% |
2.52% |
192.41 |
|
| People in Multi-Ethnic, Low-Income Areas |
1.03% |
2.10% |
48.95 |
|
| Unclassified |
0.00% |
0.06% |
0.00 |
|
|
 |
 |
 |
| £0-5K |
12.75% |
9.41% |
135.39 |
|
| £5-10K |
21.09% |
16.63% |
126.81 |
|
| £10-15K |
19.02% |
16.58% |
114.71 |
|
| £15-20K |
14.10% |
13.58% |
103.81 |
|
| £20-25K |
9.82% |
10.39% |
94.46 |
|
| £25-30K |
6.72% |
7.77% |
86.42 |
|
| £30-35K |
4.60% |
5.79% |
79.45 |
|
| £35-40K |
3.18% |
4.33% |
73.36 |
|
| £40-45K |
2.22% |
3.27% |
68.02 |
|
| £45-50K |
1.57% |
2.48% |
63.30 |
|
| £50-55K |
1.13% |
1.90% |
59.12 |
|
| £55-60K |
0.82% |
1.47% |
55.40 |
|
| £60-65K |
0.60% |
1.15% |
52.09 |
|
| £65-70K |
0.45% |
0.91% |
49.12 |
|
| £70-75K |
0.33% |
0.72% |
46.45 |
|
| £75-80K |
0.25% |
0.57% |
44.05 |
|
| £80-85K |
0.19% |
0.46% |
41.88 |
|
| £85-90K |
0.15% |
0.37% |
39.91 |
|
| £90-95K |
0.12% |
0.31% |
38.12 |
|
| £95-100K |
0.09% |
0.25% |
36.49 |
|
| £100K + |
0.39% |
1.34% |
29.20 |
|
|
|

|


|
1992-1997
|
1997-2001
|
|
|
|
| Con |
-12.40% |
| Lab |
5.69% |
| LD |
-1.46% |
|
| Con |
3.07% |
| Lab |
0.92% |
| LD |
0.45% |
|
|
 |
Ross Cranston
Labour hold
|
| Con |
 |
13,295 |
34.48% |
| Lab |
 |
20,095 |
52.11% |
| LD |
 |
3,352 |
8.69% |
| Oth |
 |
1,822 |
4.72% |
| Maj |
 |
6,800 |
17.63% |
| Turn |
 |
38,564 |
55.92% |
|
|
 |
Ross Cranston
Labour hold
|
| LD |
Richard Burt |
3,352 |
8.69% |
| L |
Ross Cranston |
20,095 |
52.11% |
| BNP |
Simon Derby |
1,822 |
4.72% |
| C |
Andrew Griffiths |
13,295 |
34.48% |
|
Candidates representing 4 parties stood for election to this seat.
|
|
 |
John Gilbert
Labour
|
| Con |
 |
15,014 |
31.40% |
| Lab |
 |
24,471 |
51.19% |
| LD |
 |
3,939 |
8.24% |
| Ref |
 |
1,201 |
2.51% |
| Oth |
 |
3,183 |
6.66% |
| Maj |
 |
9,457 |
19.78% |
| Turn |
 |
47,808 |
69.45% |
|
|
 |
|
Labour
|
| Con |
 |
23,776 |
43.80% |
| Lab |
 |
24,730 |
45.50% |
| LD |
 |
5,273 |
9.70% |
| Oth |
 |
565 |
1.00% |
| Maj |
 |
954 |
1.80% |
| Turn |
 |
54,344 |
77.10% |
|
|
 |
|

|

