|
Dulwich & West Norwood
Labour hold

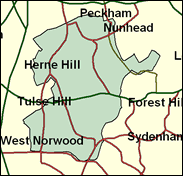
In 1997 for the first time the Boundary Commission proposed seats which crossed borders between London Boroughs. This division includes what might be regarded as the more Conservative parts of the inner south London Boroughs of Lambeth and Southwark, that is the less "inner" and hence in the main furthest south. From Southwark comes Dulwich, with its attractive urban village with art gallery, museum and public school. From Lambeth come some neighborhoods from the capital's southern heights, such as Knight's Hill, Gipsy Hill and Herne Hill, Thurlow Park, as well as West Norwood (other Norwoods like South and Upper are in Croydon North). It is a sign of the Tories' weakness in general and in London in particular that this seat too looks like a Labour banker, as Tessa Jowell won by 16,769 or 37pc after a 16.6pc swing in 1997. The arithmetic does show that if that swing hadn't happened, Labour would have been only four of five per cent ahead, so one day the Conservatives must hope that this will be marginal again. if not, they are doomed to permanent opposition.

Tessa Jowell, an Education minister, and first elected here in 1992, is an on-message identikit Blairite who defended Harriet Harman's choice of a selective school for her son and has Peter Mandelson as godfather to one of her own children. A doctor's daughter who became a social worker, she was educated at St Margaret's (private) School, Aberdeen and Edinburgh University. Though entering government in 1997, well up the order at Minister of State level, she is probably stuck there because of her involvement, as Health minister, in exempting Formula One from the tobacco sponsorship ban. Pre 1997 her sweet nature was used to reassure the Women's Institute about Labour, but not convincingly enough if their later barracking of Blair was anything to go by.
 |
| Wealthy Achievers, Suburban Areas |
0.86% |
14.99% |
5.71 |
|
| Affluent Greys, Rural Communities |
0.00% |
2.13% |
0.00 |
|
| Prosperous Pensioners, Retirement Areas |
0.85% |
2.49% |
34.13 |
|
| Affluent Executives, Family Areas |
0.19% |
4.43% |
4.40 |
|
| Well-Off Workers, Family Areas |
0.00% |
7.27% |
0.00 |
|
| Affluent Urbanites, Town & City Areas |
10.47% |
2.56% |
408.42 |
|
| Prosperous Professionals, Metropolitan Areas |
34.82% |
2.04% |
1,706.18 |
|
| Better-Off Executives, Inner City Areas |
19.79% |
3.94% |
501.86 |
|
| Comfortable Middle Agers, Mature Home Owning Areas |
1.38% |
13.04% |
10.58 |
|
| Skilled Workers, Home Owning Areas |
0.10% |
12.70% |
0.77 |
|
| New Home Owners, Mature Communities |
1.52% |
8.14% |
18.66 |
|
| White Collar Workers, Better-Off Multi Ethnic Areas |
9.29% |
4.02% |
231.03 |
|
| Older People, Less Prosperous Areas |
0.16% |
3.19% |
5.10 |
|
| Council Estate Residents, Better-Off Homes |
0.00% |
11.31% |
0.00 |
|
| Council Estate Residents, High Unemployment |
10.12% |
3.06% |
330.59 |
|
| Council Estate Residents, Greatest Hardship |
0.00% |
2.52% |
0.00 |
|
| People in Multi-Ethnic, Low-Income Areas |
10.44% |
2.10% |
496.99 |
|
| Unclassified |
0.00% |
0.06% |
0.00 |
|
|
 |
 |
 |
| £0-5K |
6.80% |
9.41% |
72.19 |
|
| £5-10K |
11.64% |
16.63% |
69.98 |
|
| £10-15K |
12.74% |
16.58% |
76.85 |
|
| £15-20K |
11.72% |
13.58% |
86.28 |
|
| £20-25K |
10.04% |
10.39% |
96.61 |
|
| £25-30K |
8.33% |
7.77% |
107.16 |
|
| £30-35K |
6.81% |
5.79% |
117.62 |
|
| £35-40K |
5.54% |
4.33% |
127.82 |
|
| £40-45K |
4.50% |
3.27% |
137.71 |
|
| £45-50K |
3.66% |
2.48% |
147.26 |
|
| £50-55K |
2.98% |
1.90% |
156.45 |
|
| £55-60K |
2.44% |
1.47% |
165.30 |
|
| £60-65K |
2.00% |
1.15% |
173.83 |
|
| £65-70K |
1.65% |
0.91% |
182.05 |
|
| £70-75K |
1.37% |
0.72% |
189.99 |
|
| £75-80K |
1.14% |
0.57% |
197.67 |
|
| £80-85K |
0.95% |
0.46% |
205.11 |
|
| £85-90K |
0.80% |
0.37% |
212.32 |
|
| £90-95K |
0.67% |
0.31% |
219.33 |
|
| £95-100K |
0.57% |
0.25% |
226.15 |
|
| £100K + |
3.63% |
1.34% |
270.02 |
|
|
|

|


|
1992-1997
|
1997-2001
|
|
|
|
| Con |
-18.60% |
| Lab |
14.66% |
| LD |
0.98% |
|
| Con |
-1.48% |
| Lab |
-6.06% |
| LD |
4.40% |
|
|
 |
Tessa Jowell
Labour hold
|
| Con |
 |
8,689 |
22.72% |
| Lab |
 |
20,999 |
54.90% |
| LD |
 |
5,806 |
15.18% |
| Oth |
 |
2,753 |
7.20% |
| Maj |
 |
12,310 |
32.19% |
| Turn |
 |
38,247 |
54.25% |
|
|
 |
Tessa Jowell
Labour hold
|
| G |
Jenny Jones |
1,914 |
5.00% |
| L |
Tessa Jowell |
20,999 |
54.90% |
| SA |
Brian Kelly |
839 |
2.19% |
| LD |
Caroline Pidgeon |
5,806 |
15.18% |
| C |
Nick Vineall |
8,689 |
22.72% |
|
Candidates representing 5 parties stood for election to this seat.
|
|
 |
Tessa Jowell
Labour
|
| Con |
 |
11,038 |
24.20% |
| Lab |
 |
27,807 |
60.96% |
| LD |
 |
4,916 |
10.78% |
| Ref |
 |
897 |
1.97% |
| Oth |
 |
957 |
2.10% |
| Maj |
 |
16,769 |
36.76% |
| Turn |
 |
45,615 |
65.49% |
|
|
 |
|
Labour
|
| Con |
 |
21,779 |
42.80% |
| Lab |
 |
23,582 |
46.30% |
| LD |
 |
4,998 |
9.80% |
| Oth |
 |
531 |
1.00% |
| Maj |
 |
1,803 |
3.50% |
| Turn |
 |
50,890 |
67.69% |
|
|
 |
|

|

