|
Dumbarton
Labour hold

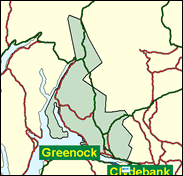
This is a varied seat in industrial west Scotland. Helensburgh at the conjunction of the mouth of the Clyde and Gare Loch is a desirable commuting base for Glasgow but its influence is subsumed by the working class Dumbarton itself and even more by the Vale of Leven, with its communities of Alexandria, Bonhill, Jamestwon, and Renton, which have such a left wing history that they were onece known as "Little Moscows". The Conservatives slipped to third behind the SNP and the Labour victors in the 1997 General Election, and this order was confirmed in the 1999 Scottish parliament contest.

John McFall elected here in 1987, is one of Blair's discarded ministers, following a stint at the Northern Ireland Office and before that a government Whip. His political career launched as a unilateralist campaigner against the local Faslane Trident base, he was born 1944, educated at St Patrick's High School, Dumbarton, Paisley College and Strathclyde University, and spent 13 years teaching chemistry. A Gulf War rebel in 1991, by the mid 1990s he was confining himself to the more anodyne radicalism of fox hunting bans.
 |
| Wealthy Achievers, Suburban Areas |
10.81% |
14.99% |
72.11 |
|
| Affluent Greys, Rural Communities |
0.67% |
2.13% |
31.65 |
|
| Prosperous Pensioners, Retirement Areas |
1.79% |
2.49% |
72.08 |
|
| Affluent Executives, Family Areas |
10.30% |
4.43% |
232.87 |
|
| Well-Off Workers, Family Areas |
10.41% |
7.27% |
143.09 |
|
| Affluent Urbanites, Town & City Areas |
6.96% |
2.56% |
271.30 |
|
| Prosperous Professionals, Metropolitan Areas |
0.64% |
2.04% |
31.25 |
|
| Better-Off Executives, Inner City Areas |
2.18% |
3.94% |
55.28 |
|
| Comfortable Middle Agers, Mature Home Owning Areas |
4.47% |
13.04% |
34.32 |
|
| Skilled Workers, Home Owning Areas |
4.44% |
12.70% |
34.97 |
|
| New Home Owners, Mature Communities |
4.45% |
8.14% |
54.67 |
|
| White Collar Workers, Better-Off Multi Ethnic Areas |
0.91% |
4.02% |
22.74 |
|
| Older People, Less Prosperous Areas |
3.72% |
3.19% |
116.76 |
|
| Council Estate Residents, Better-Off Homes |
22.65% |
11.31% |
200.23 |
|
| Council Estate Residents, High Unemployment |
6.00% |
3.06% |
195.84 |
|
| Council Estate Residents, Greatest Hardship |
9.59% |
2.52% |
380.75 |
|
| People in Multi-Ethnic, Low-Income Areas |
0.00% |
2.10% |
0.00 |
|
| Unclassified |
0.00% |
0.06% |
0.00 |
|
|
 |
 |
 |
| £0-5K |
9.59% |
9.41% |
101.89 |
|
| £5-10K |
16.27% |
16.63% |
97.81 |
|
| £10-15K |
16.36% |
16.58% |
98.65 |
|
| £15-20K |
13.66% |
13.58% |
100.56 |
|
| £20-25K |
10.64% |
10.39% |
102.37 |
|
| £25-30K |
8.06% |
7.77% |
103.67 |
|
| £30-35K |
6.04% |
5.79% |
104.35 |
|
| £35-40K |
4.52% |
4.33% |
104.43 |
|
| £40-45K |
3.40% |
3.27% |
103.98 |
|
| £45-50K |
2.56% |
2.48% |
103.11 |
|
| £50-55K |
1.94% |
1.90% |
101.91 |
|
| £55-60K |
1.48% |
1.47% |
100.44 |
|
| £60-65K |
1.14% |
1.15% |
98.80 |
|
| £65-70K |
0.88% |
0.91% |
97.03 |
|
| £70-75K |
0.68% |
0.72% |
95.18 |
|
| £75-80K |
0.54% |
0.57% |
93.28 |
|
| £80-85K |
0.42% |
0.46% |
91.36 |
|
| £85-90K |
0.34% |
0.37% |
89.45 |
|
| £90-95K |
0.27% |
0.31% |
87.56 |
|
| £95-100K |
0.21% |
0.25% |
85.71 |
|
| £100K + |
1.00% |
1.34% |
74.72 |
|
|
|

|


|
1992-1997
|
1997-2001
|
|
|
|
| Con |
-12.05% |
| Lab |
6.01% |
| LD |
-0.18% |
| SNP |
4.83% |
|
| Con |
-3.98% |
| Lab |
-2.10% |
| LD |
7.87% |
| SNP |
-3.89% |
|
|
 |
John McFall
Labour hold
|
| Con |
 |
4,648 |
13.67% |
| Lab |
 |
16,151 |
47.51% |
| LD |
 |
5,265 |
15.49% |
| SNP |
 |
6,576 |
19.34% |
| Oth |
 |
1,354 |
3.98% |
| Maj |
 |
9,575 |
28.17% |
| Turn |
 |
33,994 |
60.42% |
|
|
 |
John McFall
Labour hold
|
| LC |
John McFall |
16,151 |
47.51% |
| C |
Peter Ramsay |
4,648 |
13.67% |
| SNP |
Iain Robertson |
6,576 |
19.34% |
| SSP |
Les Robertson |
1,354 |
3.98% |
| LD |
Eric Thompson |
5,265 |
15.49% |
|
Candidates representing 5 parties stood for election to this seat.
|
|
 |
John McFall
Labour
|
| Con |
 |
7,283 |
17.65% |
| Lab |
 |
20,470 |
49.61% |
| LD |
 |
3,144 |
7.62% |
| SNP |
 |
9,587 |
23.23% |
| Ref |
 |
255 |
0.62% |
| Oth |
 |
525 |
1.27% |
| Maj |
 |
10,883 |
26.37% |
| Turn |
 |
41,264 |
73.39% |
|
|
 |
|
Labour
|
| Con |
 |
13,126 |
29.70% |
| Lab |
 |
19,255 |
43.60% |
| LD |
 |
3,425 |
7.80% |
| SNP |
 |
8,127 |
18.40% |
| Oth |
 |
192 |
0.40% |
| Maj |
 |
6,129 |
13.90% |
| Turn |
 |
44,125 |
76.22% |
|
|
 |
|

|

