|
Dundee East
Labour hold

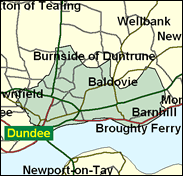
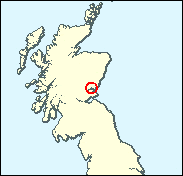
Historically Dundee East is the strongest ever Scottish nationalist seat in industrial Scotland - and one of its two strongest seats anywhere (the other is th very individual Western Isles). However, the legacy of the past is falling away. From February 1974 to 1987 the MP here was Gordon Wilson, the SNP's parliamentary leader. For much of that time it was the only nationalist seat in Scotland. the leadership probably gave Wilson a boost against Labour that his colleagues lacked, for they lost their seats in 1979 whil he held on against a party which was in bad shape in Britain as a whole, but for which Scotland was clearly the best region. As Labour grew stronger though, even Wilson could not resist, and John McAllion has been winning contests since (three for Westminster, and in 1999 for the Edinburgh parliament). Dundee West was nearly won by the SNP in the 1999 Scottish parliamentary elections, and now looks their better bet in the Tayside port once known as Juteopolis, a world centre for textile trading.

Local councillor Iain Luke has replaced the disappeared-to-Holyrood John McAllion. Born 1951, educated at Harris Academy Dundee, Dundee University (Politics and History) and Edinburgh University (Diploma in Business Administration). He was a civil servant for five years (1969-74) but has been a college lecturer since 1983, currently in public administration, housing and European studies at Dundee College.
 |
| Wealthy Achievers, Suburban Areas |
12.59% |
14.99% |
83.99 |
|
| Affluent Greys, Rural Communities |
0.00% |
2.13% |
0.00 |
|
| Prosperous Pensioners, Retirement Areas |
2.72% |
2.49% |
109.45 |
|
| Affluent Executives, Family Areas |
1.31% |
4.43% |
29.55 |
|
| Well-Off Workers, Family Areas |
9.50% |
7.27% |
130.66 |
|
| Affluent Urbanites, Town & City Areas |
3.35% |
2.56% |
130.46 |
|
| Prosperous Professionals, Metropolitan Areas |
0.49% |
2.04% |
24.16 |
|
| Better-Off Executives, Inner City Areas |
7.38% |
3.94% |
187.14 |
|
| Comfortable Middle Agers, Mature Home Owning Areas |
2.84% |
13.04% |
21.76 |
|
| Skilled Workers, Home Owning Areas |
2.87% |
12.70% |
22.59 |
|
| New Home Owners, Mature Communities |
2.40% |
8.14% |
29.43 |
|
| White Collar Workers, Better-Off Multi Ethnic Areas |
1.13% |
4.02% |
28.00 |
|
| Older People, Less Prosperous Areas |
6.62% |
3.19% |
207.95 |
|
| Council Estate Residents, Better-Off Homes |
18.36% |
11.31% |
162.34 |
|
| Council Estate Residents, High Unemployment |
18.57% |
3.06% |
606.32 |
|
| Council Estate Residents, Greatest Hardship |
9.49% |
2.52% |
376.91 |
|
| People in Multi-Ethnic, Low-Income Areas |
0.25% |
2.10% |
11.71 |
|
| Unclassified |
0.13% |
0.06% |
215.50 |
|
|
 |
 |
 |
| £0-5K |
12.14% |
9.41% |
129.00 |
|
| £5-10K |
20.84% |
16.63% |
125.32 |
|
| £10-15K |
18.94% |
16.58% |
114.22 |
|
| £15-20K |
13.98% |
13.58% |
102.93 |
|
| £20-25K |
9.70% |
10.39% |
93.30 |
|
| £25-30K |
6.65% |
7.77% |
85.57 |
|
| £30-35K |
4.61% |
5.79% |
79.52 |
|
| £35-40K |
3.24% |
4.33% |
74.76 |
|
| £40-45K |
2.32% |
3.27% |
70.98 |
|
| £45-50K |
1.69% |
2.48% |
67.92 |
|
| £50-55K |
1.24% |
1.90% |
65.36 |
|
| £55-60K |
0.93% |
1.47% |
63.18 |
|
| £60-65K |
0.71% |
1.15% |
61.27 |
|
| £65-70K |
0.54% |
0.91% |
59.55 |
|
| £70-75K |
0.42% |
0.72% |
57.99 |
|
| £75-80K |
0.32% |
0.57% |
56.53 |
|
| £80-85K |
0.26% |
0.46% |
55.15 |
|
| £85-90K |
0.20% |
0.37% |
53.85 |
|
| £90-95K |
0.16% |
0.31% |
52.60 |
|
| £95-100K |
0.13% |
0.25% |
51.39 |
|
| £100K + |
0.59% |
1.34% |
44.19 |
|
|
|

|


|
1992-1997
|
1997-2001
|
|
|
|
| Con |
-2.62% |
| Lab |
6.82% |
| LD |
-0.16% |
| SNP |
-5.56% |
|
| Con |
-3.73% |
| Lab |
-5.89% |
| LD |
4.47% |
| SNP |
4.86% |
|
|
 |
Iain Luke
Labour hold
|
| Con |
 |
3,900 |
12.05% |
| Lab |
 |
14,635 |
45.23% |
| LD |
 |
2,784 |
8.60% |
| SNP |
 |
10,160 |
31.40% |
| Oth |
 |
879 |
2.72% |
| Maj |
 |
4,475 |
13.83% |
| Turn |
 |
32,358 |
57.24% |
|
|
 |
Iain Luke
Labour hold
|
| C |
Alan Donnelly |
3,900 |
12.05% |
| SSP |
Harvey Duke |
879 |
2.72% |
| SNP |
Stewart Hosie |
10,160 |
31.40% |
| LD |
Raymond Lawrie |
2,784 |
8.60% |
| L |
Iain Luke |
14,635 |
45.23% |
|
Candidates representing 5 parties stood for election to this seat.
|
|
 |
John McAllion
Labour
|
| Con |
 |
6,397 |
15.78% |
| Lab |
 |
20,718 |
51.12% |
| LD |
 |
1,677 |
4.14% |
| SNP |
 |
10,757 |
26.54% |
| Ref |
 |
601 |
1.48% |
| Oth |
 |
378 |
0.93% |
| Maj |
 |
9,961 |
24.58% |
| Turn |
 |
40,528 |
69.41% |
|
|
 |
|
Labour
|
| Con |
 |
8,297 |
18.40% |
| Lab |
 |
19,954 |
44.30% |
| LD |
 |
1,939 |
4.30% |
| SNP |
 |
14,437 |
32.10% |
| Oth |
 |
372 |
0.80% |
| Maj |
 |
5,517 |
12.30% |
| Turn |
 |
44,999 |
73.42% |
|
|
 |
|

|

