|
Aylesbury
Conservative hold

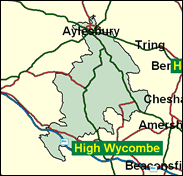
It is not the rather mixed town of Aylesbury itself -with its sprawling middle and working class estates - which has kept this seat in the hands of the Conservatives even in their darkest years, but the half of the electorate located in the small towns and villages such as Great Missenden, Princes Risborough, Stokenchurch and Wendover. Buckinghamshire is one of the most Tory of counties, along with Surrey and Dorset, and the only one whose county council remained in the overall control of the Tories throughout their 18 years in national government. David Lidington is a deputy to Ann Widdecombe as home affairs shadow and spoke from the front bench on foxhunting. There is little thrill for other parties in the fruitless chase of Mr Lidington here in the Vale of Aylesbury.

David Lidington, elected in 1992, is a mildly Eurosceptic orthodox loyalist member of Hague’s frontbench home affairs team, having been for two years his leader’s PPS. As a former adviser to Douglas Hurd, he made a guarded defence of the Maastricht treaty, favouring a Europe of "variable geometry". Born 1956, and educated at Haberdashers' Aske's and Sidney Sussex College, Cambridge (acquiring a doctorate in History, which he decently ignores in his mode of address), he was previously a PR man with RTZ and BP. Sensing the mood, and as his former PPS, he voted for Michael Howard for leader in 1997, then prudently switched to Hague in the final ballots.

 |
| Wealthy Achievers, Suburban Areas |
31.88% |
14.99% |
212.63 |
|
| Affluent Greys, Rural Communities |
0.00% |
2.13% |
0.00 |
|
| Prosperous Pensioners, Retirement Areas |
2.16% |
2.49% |
86.73 |
|
| Affluent Executives, Family Areas |
12.99% |
4.43% |
293.50 |
|
| Well-Off Workers, Family Areas |
9.88% |
7.27% |
135.78 |
|
| Affluent Urbanites, Town & City Areas |
3.38% |
2.56% |
131.83 |
|
| Prosperous Professionals, Metropolitan Areas |
0.00% |
2.04% |
0.00 |
|
| Better-Off Executives, Inner City Areas |
0.53% |
3.94% |
13.40 |
|
| Comfortable Middle Agers, Mature Home Owning Areas |
10.18% |
13.04% |
78.11 |
|
| Skilled Workers, Home Owning Areas |
6.55% |
12.70% |
51.53 |
|
| New Home Owners, Mature Communities |
6.87% |
8.14% |
84.37 |
|
| White Collar Workers, Better-Off Multi Ethnic Areas |
1.00% |
4.02% |
24.92 |
|
| Older People, Less Prosperous Areas |
1.86% |
3.19% |
58.49 |
|
| Council Estate Residents, Better-Off Homes |
11.00% |
11.31% |
97.29 |
|
| Council Estate Residents, High Unemployment |
0.24% |
3.06% |
7.77 |
|
| Council Estate Residents, Greatest Hardship |
1.21% |
2.52% |
48.24 |
|
| People in Multi-Ethnic, Low-Income Areas |
0.27% |
2.10% |
12.73 |
|
| Unclassified |
0.00% |
0.06% |
0.00 |
|
|
 |
 |
 |
| £0-5K |
5.39% |
9.41% |
57.27 |
|
| £5-10K |
11.52% |
16.63% |
69.25 |
|
| £10-15K |
13.58% |
16.58% |
81.93 |
|
| £15-20K |
12.78% |
13.58% |
94.09 |
|
| £20-25K |
10.93% |
10.39% |
105.21 |
|
| £25-30K |
8.95% |
7.77% |
115.12 |
|
| £30-35K |
7.17% |
5.79% |
123.83 |
|
| £35-40K |
5.69% |
4.33% |
131.43 |
|
| £40-45K |
4.51% |
3.27% |
138.06 |
|
| £45-50K |
3.57% |
2.48% |
143.83 |
|
| £50-55K |
2.84% |
1.90% |
148.88 |
|
| £55-60K |
2.26% |
1.47% |
153.31 |
|
| £60-65K |
1.81% |
1.15% |
157.21 |
|
| £65-70K |
1.46% |
0.91% |
160.65 |
|
| £70-75K |
1.18% |
0.72% |
163.71 |
|
| £75-80K |
0.96% |
0.57% |
166.44 |
|
| £80-85K |
0.78% |
0.46% |
168.87 |
|
| £85-90K |
0.64% |
0.37% |
171.04 |
|
| £90-95K |
0.53% |
0.31% |
173.00 |
|
| £95-100K |
0.44% |
0.25% |
174.76 |
|
| £100K + |
2.44% |
1.34% |
181.62 |
|
|
|

|


|
1992-1997
|
1997-2001
|
|
|
|
| Con |
-13.12% |
| Lab |
8.77% |
| LD |
1.75% |
|
| Con |
3.15% |
| Lab |
1.03% |
| LD |
-2.62% |
|
|
 |
David Lidington
Conservative hold
|
| Con |
 |
23,230 |
47.32% |
| Lab |
 |
11,388 |
23.20% |
| LD |
 |
13,221 |
26.93% |
| Oth |
 |
1,248 |
2.54% |
| Maj |
 |
10,009 |
20.39% |
| Turn |
 |
49,087 |
61.36% |
|
|
 |
David Lidington
Conservative hold
|
| UK |
Justin Harper |
1,248 |
2.54% |
| LD |
Peter Jones |
13,221 |
26.93% |
| C |
David Lidington |
23,230 |
47.32% |
| L |
Keith White |
11,388 |
23.20% |
|
Candidates representing 4 parties stood for election to this seat.
|
|
 |
David Lidington
Conservative
|
| Con |
 |
25,426 |
44.18% |
| Lab |
 |
12,759 |
22.17% |
| LD |
 |
17,007 |
29.55% |
| Ref |
 |
2,196 |
3.82% |
| Oth |
 |
166 |
0.29% |
| Maj |
 |
8,419 |
14.63% |
| Turn |
 |
57,554 |
72.81% |
|
|
 |
|
Conservative
|
| Con |
 |
34,983 |
57.30% |
| Lab |
 |
8,205 |
13.40% |
| LD |
 |
16,943 |
27.80% |
| Oth |
 |
904 |
1.50% |
| Maj |
 |
18,040 |
29.60% |
| Turn |
 |
61,035 |
80.21% |
|
|
 |
|

|

