|
Dunfermline East
Labour hold

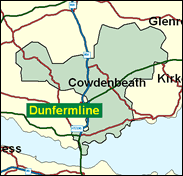
Gordon Brown represents a seat with a very strong Left-wing tradition, not just Labour but further left than that. This is in many ways the true scussor to the West Fife seat held by the Communist Willie Gallacher from 1935 to 1950, and in the inter-war years some of the mining communities here were known as "Little Moscows" - Lumphinnans being the best known example. More recently even as late as the 1990s a Communist was representing the Ballingry/Lochore electoral division in the Fife regional council elections, defeating a Labour candidate in May 1990. Nobody is suggesting that Gordon Brown is in this mould, not for one minute, and indeed West Fife itself was regained for Labour and held from 1950 to 1983 by Willie Hamilton, who was a right winger although best known by the public for his sentiments against the monarchy. This seat is very solidly mainstream Labour now, with its threatened dockyard town of Rosyth and the end of mining in the coalfield centred on Cowdenbeath, which somehow appropriately has one of the historically least successful but most keenly supported football teams in the lower divisions of the Scottish league. The 2000-1 Third Division season has brought the club truly astonishing (relative) success, and it is predicted here that Gordon Brown will be swept back to Westminster amid the resulting glow.

Gordon Brown, Labour's 'tough but fair' Iron Chancellor, is the first of Labour's eight Chancellors (Snowden, Dalton, Cripps, Gaitskell, Callaghan, Jenkins and Healey) to enjoy liberally overflowing coffers, and so able to combine a Presbyterian devotion to 'Prudence' with an allegedly massive investment in public services. A son of the Manse, born 1951 and educated at Kirkcaldy High School (losing an eye), and with a History doctorate from Edinburgh University, he finally married in 2000. With his ambitions thwarted by Blair (and Mandelson) in 1994, his supporters in government marginalised in reshuffles since 1997, and as a man more spun against than spinning, he may yet, barring a major economic downturn, inherit the earth. It may be sooner - in the wake of a shock election result scything down Labour's backbench foot soldiers and destabilising the Blair premiership - or later, with the need for a Caledonian hero to save the Union after bad Scottish Parliament election results in 2004. Look how many Canadian Prime Ministers come from Quebec.
 |
| Wealthy Achievers, Suburban Areas |
5.58% |
14.99% |
37.19 |
|
| Affluent Greys, Rural Communities |
0.00% |
2.13% |
0.00 |
|
| Prosperous Pensioners, Retirement Areas |
0.22% |
2.49% |
8.83 |
|
| Affluent Executives, Family Areas |
6.27% |
4.43% |
141.61 |
|
| Well-Off Workers, Family Areas |
11.69% |
7.27% |
160.77 |
|
| Affluent Urbanites, Town & City Areas |
2.13% |
2.56% |
83.18 |
|
| Prosperous Professionals, Metropolitan Areas |
0.61% |
2.04% |
29.89 |
|
| Better-Off Executives, Inner City Areas |
0.13% |
3.94% |
3.19 |
|
| Comfortable Middle Agers, Mature Home Owning Areas |
1.57% |
13.04% |
12.02 |
|
| Skilled Workers, Home Owning Areas |
8.89% |
12.70% |
69.96 |
|
| New Home Owners, Mature Communities |
12.97% |
8.14% |
159.33 |
|
| White Collar Workers, Better-Off Multi Ethnic Areas |
0.06% |
4.02% |
1.58 |
|
| Older People, Less Prosperous Areas |
6.65% |
3.19% |
208.65 |
|
| Council Estate Residents, Better-Off Homes |
29.18% |
11.31% |
257.96 |
|
| Council Estate Residents, High Unemployment |
6.20% |
3.06% |
202.51 |
|
| Council Estate Residents, Greatest Hardship |
7.86% |
2.52% |
311.99 |
|
| People in Multi-Ethnic, Low-Income Areas |
0.00% |
2.10% |
0.00 |
|
| Unclassified |
0.00% |
0.06% |
0.00 |
|
|
 |
 |
 |
| £0-5K |
11.50% |
9.41% |
122.12 |
|
| £5-10K |
20.17% |
16.63% |
121.27 |
|
| £10-15K |
18.67% |
16.58% |
112.58 |
|
| £15-20K |
14.04% |
13.58% |
103.39 |
|
| £20-25K |
9.93% |
10.39% |
95.55 |
|
| £25-30K |
6.94% |
7.77% |
89.28 |
|
| £30-35K |
4.88% |
5.79% |
84.32 |
|
| £35-40K |
3.48% |
4.33% |
80.35 |
|
| £40-45K |
2.52% |
3.27% |
77.09 |
|
| £45-50K |
1.84% |
2.48% |
74.32 |
|
| £50-55K |
1.37% |
1.90% |
71.88 |
|
| £55-60K |
1.03% |
1.47% |
69.67 |
|
| £60-65K |
0.78% |
1.15% |
67.63 |
|
| £65-70K |
0.60% |
0.91% |
65.71 |
|
| £70-75K |
0.46% |
0.72% |
63.87 |
|
| £75-80K |
0.36% |
0.57% |
62.10 |
|
| £80-85K |
0.28% |
0.46% |
60.39 |
|
| £85-90K |
0.22% |
0.37% |
58.73 |
|
| £90-95K |
0.17% |
0.31% |
57.12 |
|
| £95-100K |
0.14% |
0.25% |
55.56 |
|
| £100K + |
0.63% |
1.34% |
46.56 |
|
|
|

|


|
1992-1997
|
1997-2001
|
|
|
|
| Con |
-6.31% |
| Lab |
3.91% |
| LD |
-0.18% |
| SNP |
0.85% |
|
| Con |
-0.56% |
| Lab |
-2.04% |
| LD |
1.67% |
| SNP |
-0.85% |
|
|
 |
Gordon Brown
Labour hold
|
| Con |
 |
2,838 |
9.43% |
| Lab |
 |
19,487 |
64.77% |
| LD |
 |
2,281 |
7.58% |
| SNP |
 |
4,424 |
14.70% |
| Oth |
 |
1,056 |
3.51% |
| Maj |
 |
15,063 |
50.07% |
| Turn |
 |
30,086 |
56.97% |
|
|
 |
Gordon Brown
Labour hold
|
| L |
Gordon Brown |
19,487 |
64.77% |
| UK |
Tom Dunsmore |
770 |
2.56% |
| SSP |
Andy Jackson |
286 |
0.95% |
| LD |
John Mainland |
2,281 |
7.58% |
| SNP |
John Mellon |
4,424 |
14.70% |
| C |
Stuart Randall |
2,838 |
9.43% |
|
Candidates representing 6 parties stood for election to this seat.
|
|
 |
Gordon Brown
Labour
|
| Con |
 |
3,656 |
9.99% |
| Lab |
 |
24,441 |
66.81% |
| LD |
 |
2,164 |
5.92% |
| SNP |
 |
5,690 |
15.55% |
| Ref |
 |
632 |
1.73% |
| Oth |
|
0 |
0.00% |
| Maj |
 |
18,751 |
51.26% |
| Turn |
 |
36,583 |
70.25% |
|
|
 |
|
Labour
|
| Con |
 |
6,211 |
16.30% |
| Lab |
 |
23,966 |
62.90% |
| LD |
 |
2,329 |
6.10% |
| SNP |
 |
5,619 |
14.70% |
| Oth |
|
0 |
0.00% |
| Maj |
 |
17,755 |
46.60% |
| Turn |
 |
38,125 |
75.24% |
|
|
 |
|

|

