|
Durham North
Labour hold

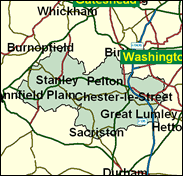
Similar to the seat formerly named Chester le Street, this is a seat with one of the longest histories of continuous Labour party representation. The old Chester le Street was gained in 1906, and never lost, even in a byelection in the Liberals' annus mirabilis of 1973, when they carried all before them elsewhere, and even though the town of that name is quite a prosperous staging point on the original route form Newcastle to London, and is overshadowed by the stately Lambton Park - which also overlooks a fine new cricket ground purpose built to become the next Test arena. In the 1999 local elections Labour took 30 of the 33 council places available on Chester le Street district, and also dominated the Derwentside section around Stanley and Annfield Plain. Their 26,000 majority is invulnerable.

With the retreat of Labour's patrician Wykehamist Giles Radice comes Kevan Jones, who shares with his predecessor at least his career as a GMB union official in this, its North Eastern regional stronghold. Born in 1964 and educated at Portland Comprehensive, Worksop, Nottinghamshire and Newcastle Poly and the University of Southern Maine, Portland, USA, he is currently Northern Regional Political Officer of the GMB, Chief Whip of the ruling Labour Group on Newcastle City Council, where he has been a councillor since 1990, and a leading figure in the Northern Regional Labour Party. A campaigner on 'asbestos awareness', he comes with impeccable party, municipal and union credentials to take up where Radice left off after 28 years in a rock-solid Labour seat.
 |
| Wealthy Achievers, Suburban Areas |
2.69% |
14.99% |
17.96 |
|
| Affluent Greys, Rural Communities |
0.00% |
2.13% |
0.00 |
|
| Prosperous Pensioners, Retirement Areas |
0.04% |
2.49% |
1.71 |
|
| Affluent Executives, Family Areas |
8.03% |
4.43% |
181.36 |
|
| Well-Off Workers, Family Areas |
10.53% |
7.27% |
144.80 |
|
| Affluent Urbanites, Town & City Areas |
0.00% |
2.56% |
0.00 |
|
| Prosperous Professionals, Metropolitan Areas |
0.00% |
2.04% |
0.00 |
|
| Better-Off Executives, Inner City Areas |
0.00% |
3.94% |
0.00 |
|
| Comfortable Middle Agers, Mature Home Owning Areas |
10.28% |
13.04% |
78.86 |
|
| Skilled Workers, Home Owning Areas |
27.64% |
12.70% |
217.57 |
|
| New Home Owners, Mature Communities |
11.55% |
8.14% |
141.89 |
|
| White Collar Workers, Better-Off Multi Ethnic Areas |
0.16% |
4.02% |
4.06 |
|
| Older People, Less Prosperous Areas |
5.35% |
3.19% |
168.08 |
|
| Council Estate Residents, Better-Off Homes |
18.29% |
11.31% |
161.68 |
|
| Council Estate Residents, High Unemployment |
0.82% |
3.06% |
26.76 |
|
| Council Estate Residents, Greatest Hardship |
4.61% |
2.52% |
182.94 |
|
| People in Multi-Ethnic, Low-Income Areas |
0.00% |
2.10% |
0.00 |
|
| Unclassified |
0.00% |
0.06% |
0.00 |
|
|
 |
 |
 |
| £0-5K |
12.87% |
9.41% |
136.76 |
|
| £5-10K |
20.80% |
16.63% |
125.06 |
|
| £10-15K |
18.69% |
16.58% |
112.72 |
|
| £15-20K |
13.84% |
13.58% |
101.86 |
|
| £20-25K |
9.66% |
10.39% |
92.99 |
|
| £25-30K |
6.67% |
7.77% |
85.85 |
|
| £30-35K |
4.64% |
5.79% |
80.05 |
|
| £35-40K |
3.26% |
4.33% |
75.25 |
|
| £40-45K |
2.32% |
3.27% |
71.19 |
|
| £45-50K |
1.68% |
2.48% |
67.70 |
|
| £50-55K |
1.23% |
1.90% |
64.63 |
|
| £55-60K |
0.91% |
1.47% |
61.91 |
|
| £60-65K |
0.68% |
1.15% |
59.46 |
|
| £65-70K |
0.52% |
0.91% |
57.23 |
|
| £70-75K |
0.40% |
0.72% |
55.20 |
|
| £75-80K |
0.31% |
0.57% |
53.33 |
|
| £80-85K |
0.24% |
0.46% |
51.59 |
|
| £85-90K |
0.19% |
0.37% |
49.98 |
|
| £90-95K |
0.15% |
0.31% |
48.47 |
|
| £95-100K |
0.12% |
0.25% |
47.06 |
|
| £100K + |
0.53% |
1.34% |
39.77 |
|
|
|

|


|
1992-1997
|
1997-2001
|
|
|
|
| Con |
-10.39% |
| Lab |
10.36% |
| LD |
-4.22% |
|
| Con |
4.26% |
| Lab |
-3.06% |
| LD |
2.95% |
|
|
 |
Kevan Jones
Labour hold
|
| Con |
 |
7,237 |
18.76% |
| Lab |
 |
25,920 |
67.21% |
| LD |
 |
5,411 |
14.03% |
| Oth |
|
0 |
0.00% |
| Maj |
 |
18,683 |
48.44% |
| Turn |
 |
38,568 |
57.04% |
|
|
 |
Kevan Jones
Labour hold
|
| LD |
Carole Field |
5,411 |
14.03% |
| L |
Kevan Jones |
25,920 |
67.21% |
| C |
Matthew Palmer |
7,237 |
18.76% |
|
Candidates representing 3 parties stood for election to this seat.
|
|
 |
Giles Radice
Labour
|
| Con |
 |
6,843 |
14.51% |
| Lab |
 |
33,142 |
70.26% |
| LD |
 |
5,225 |
11.08% |
| Ref |
 |
1,958 |
4.15% |
| Oth |
|
0 |
0.00% |
| Maj |
 |
26,299 |
55.76% |
| Turn |
 |
47,168 |
69.48% |
|
|
 |
|
Labour
|
| Con |
 |
12,610 |
24.90% |
| Lab |
 |
30,374 |
59.90% |
| LD |
 |
7,755 |
15.30% |
| Oth |
|
0 |
0.00% |
| Maj |
 |
17,764 |
35.00% |
| Turn |
 |
50,739 |
76.30% |
|
|
 |
|

|

