|
Durham, City of
Labour hold

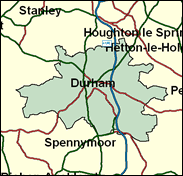
This is a curiously named seat, for the distinguished city of Durham in fact includes only a minority of its electors, with its population of under 30,000. With its establishment presence, Durham itself might be thought to be a conservative area, but is not, and even more Labour are the ex-mining communities around, such as Brandon and Byshottles, Coxhoe, Sherburn and the the Deerness valley to the west of the city. The SDP did challenge strongly in the 1980s, but that was a dark period for Labour, and it is arguable that New Labour has stolen much of the same ground anyway. Whatever the cause, Gerry Steinberg has built up his majority here to an impregnable 22,500.

Gerry Steinberg, MP here since 1987, is from Labour's chalk face. He was born 1945 and traumatised by failure at the 11+, though later transferred to Durham Johnstone Grammar School. He trained as a teacher at Sheffield College of Education and taught in special schools for 20 years. He was duly outraged by Harriet Harman's use of selective schools for her children. A Eurosceptic, who none-the-less appreciates EU money for his dead coalfield, he is a staunch Zionist, whose likeness to Groucho Marx was seriously affected by the removal of his ample moustache.
 |
| Wealthy Achievers, Suburban Areas |
15.93% |
14.99% |
106.22 |
|
| Affluent Greys, Rural Communities |
0.00% |
2.13% |
0.00 |
|
| Prosperous Pensioners, Retirement Areas |
1.26% |
2.49% |
50.68 |
|
| Affluent Executives, Family Areas |
5.57% |
4.43% |
125.87 |
|
| Well-Off Workers, Family Areas |
11.92% |
7.27% |
163.94 |
|
| Affluent Urbanites, Town & City Areas |
4.57% |
2.56% |
178.33 |
|
| Prosperous Professionals, Metropolitan Areas |
0.82% |
2.04% |
40.18 |
|
| Better-Off Executives, Inner City Areas |
4.70% |
3.94% |
119.10 |
|
| Comfortable Middle Agers, Mature Home Owning Areas |
6.74% |
13.04% |
51.69 |
|
| Skilled Workers, Home Owning Areas |
11.51% |
12.70% |
90.64 |
|
| New Home Owners, Mature Communities |
22.84% |
8.14% |
280.48 |
|
| White Collar Workers, Better-Off Multi Ethnic Areas |
0.38% |
4.02% |
9.37 |
|
| Older People, Less Prosperous Areas |
2.96% |
3.19% |
92.91 |
|
| Council Estate Residents, Better-Off Homes |
9.16% |
11.31% |
80.96 |
|
| Council Estate Residents, High Unemployment |
0.06% |
3.06% |
1.94 |
|
| Council Estate Residents, Greatest Hardship |
1.54% |
2.52% |
61.10 |
|
| People in Multi-Ethnic, Low-Income Areas |
0.00% |
2.10% |
0.00 |
|
| Unclassified |
0.04% |
0.06% |
70.73 |
|
|
 |
 |
 |
| £0-5K |
10.22% |
9.41% |
108.56 |
|
| £5-10K |
17.34% |
16.63% |
104.27 |
|
| £10-15K |
16.83% |
16.58% |
101.52 |
|
| £15-20K |
13.58% |
13.58% |
99.95 |
|
| £20-25K |
10.29% |
10.39% |
98.98 |
|
| £25-30K |
7.64% |
7.77% |
98.25 |
|
| £30-35K |
5.65% |
5.79% |
97.60 |
|
| £35-40K |
4.20% |
4.33% |
96.92 |
|
| £40-45K |
3.14% |
3.27% |
96.21 |
|
| £45-50K |
2.37% |
2.48% |
95.46 |
|
| £50-55K |
1.80% |
1.90% |
94.68 |
|
| £55-60K |
1.38% |
1.47% |
93.87 |
|
| £60-65K |
1.07% |
1.15% |
93.05 |
|
| £65-70K |
0.84% |
0.91% |
92.22 |
|
| £70-75K |
0.66% |
0.72% |
91.40 |
|
| £75-80K |
0.52% |
0.57% |
90.58 |
|
| £80-85K |
0.42% |
0.46% |
89.77 |
|
| £85-90K |
0.33% |
0.37% |
88.97 |
|
| £90-95K |
0.27% |
0.31% |
88.19 |
|
| £95-100K |
0.22% |
0.25% |
87.42 |
|
| £100K + |
1.11% |
1.34% |
82.62 |
|
|
|

|


|
1992-1997
|
1997-2001
|
|
|
|
| Con |
-6.20% |
| Lab |
10.00% |
| LD |
-6.24% |
|
| Con |
-0.22% |
| Lab |
-7.25% |
| LD |
8.39% |
|
|
 |
Gerry Steinberg
Labour hold
|
| Con |
 |
7,167 |
17.28% |
| Lab |
 |
23,254 |
56.05% |
| LD |
 |
9,813 |
23.65% |
| Oth |
 |
1,252 |
3.02% |
| Maj |
 |
13,441 |
32.40% |
| Turn |
 |
41,486 |
59.58% |
|
|
 |
Gerry Steinberg
Labour hold
|
| C |
Nick Cartmell |
7,167 |
17.28% |
| L |
Gerry Steinberg |
23,254 |
56.05% |
| UK |
Chris Williamson |
1,252 |
3.02% |
| LD |
Carol Woods |
9,813 |
23.65% |
|
Candidates representing 4 parties stood for election to this seat.
|
|
 |
Gerald Steinberg
Labour
|
| Con |
 |
8,598 |
17.50% |
| Lab |
 |
31,102 |
63.30% |
| LD |
 |
7,499 |
15.26% |
| Ref |
 |
1,723 |
3.51% |
| Oth |
 |
213 |
0.43% |
| Maj |
 |
22,504 |
45.80% |
| Turn |
 |
49,135 |
70.86% |
|
|
 |
|
Labour
|
| Con |
 |
12,037 |
23.70% |
| Lab |
 |
27,095 |
53.30% |
| LD |
 |
10,915 |
21.50% |
| Oth |
 |
812 |
1.60% |
| Maj |
 |
15,058 |
29.60% |
| Turn |
 |
50,859 |
74.25% |
|
|
 |
|

|

