|
Ealing North
Labour hold

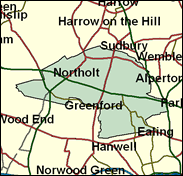
This part of the west London Borough has often been highly marginal in the past, and will be again in the future, when the Labour and Conservative parties again achieve parity, or anything close to it. In the Ealing Borough elections of May 1998 Labour's lead within this seat had been cut from 16pc to 6pc. The Conservatives won comfortably in Pitshanger ward, and Labour triumphed easily in Hobbayne, Horsenden and West End, but all the others were marginal and some three councillor seats split between the two main parties. In the Euro-elections another year later, in June 1999, the Labour lead was further cut, to 4pc. Yet it should not be assumed that this progression will continue to benefit the Tories in what is obviously a tightly fought part of London. If anything this evidence suggests that Labour will win the next General Election in Ealing North, for they can be expected to do worse in midterm, especially in European elections, than at the end of a term. As things stand, though, Stephen Pound is the strong favourite to win again in June 2001.

Steve Pound, a bald and beaky Mr Punch lookalike, Labour victor here in 1997, is an off-message card, who plays to the gallery, as in his call at the Labour Party conference Tribune Rally in 1999 to "put up two fingers to New Labour's authoritarian strain". For Sixties nostalgics, he is the boy who bought the pills with which Stephen Ward committed suicide, his journalist father, Pelham Pound, having befriended and stood bail for the Profumo scandal's osteopath and pimp. The closest the PLP gets to having a stand-up comedian, he was born in 1948, educated at Hertford Grammar School, and as a mature student at LSE. He spent 15 years on Ealing council. Self-described as "no slavish lickspittle of the front bench", he is in fact more whimsical joker than actual rebel.
 |
| Wealthy Achievers, Suburban Areas |
1.97% |
14.99% |
13.17 |
|
| Affluent Greys, Rural Communities |
0.00% |
2.13% |
0.00 |
|
| Prosperous Pensioners, Retirement Areas |
0.59% |
2.49% |
23.73 |
|
| Affluent Executives, Family Areas |
0.00% |
4.43% |
0.00 |
|
| Well-Off Workers, Family Areas |
0.00% |
7.27% |
0.00 |
|
| Affluent Urbanites, Town & City Areas |
13.84% |
2.56% |
539.48 |
|
| Prosperous Professionals, Metropolitan Areas |
9.65% |
2.04% |
472.56 |
|
| Better-Off Executives, Inner City Areas |
1.65% |
3.94% |
41.90 |
|
| Comfortable Middle Agers, Mature Home Owning Areas |
7.60% |
13.04% |
58.25 |
|
| Skilled Workers, Home Owning Areas |
11.34% |
12.70% |
89.29 |
|
| New Home Owners, Mature Communities |
4.91% |
8.14% |
60.30 |
|
| White Collar Workers, Better-Off Multi Ethnic Areas |
28.38% |
4.02% |
705.72 |
|
| Older People, Less Prosperous Areas |
2.72% |
3.19% |
85.52 |
|
| Council Estate Residents, Better-Off Homes |
7.69% |
11.31% |
68.03 |
|
| Council Estate Residents, High Unemployment |
6.49% |
3.06% |
212.01 |
|
| Council Estate Residents, Greatest Hardship |
0.78% |
2.52% |
30.84 |
|
| People in Multi-Ethnic, Low-Income Areas |
2.39% |
2.10% |
113.58 |
|
| Unclassified |
0.00% |
0.06% |
0.00 |
|
|
 |
 |
 |
| £0-5K |
5.58% |
9.41% |
59.25 |
|
| £5-10K |
11.35% |
16.63% |
68.23 |
|
| £10-15K |
13.29% |
16.58% |
80.19 |
|
| £15-20K |
12.56% |
13.58% |
92.46 |
|
| £20-25K |
10.82% |
10.39% |
104.14 |
|
| £25-30K |
8.93% |
7.77% |
114.87 |
|
| £30-35K |
7.22% |
5.79% |
124.57 |
|
| £35-40K |
5.77% |
4.33% |
133.26 |
|
| £40-45K |
4.60% |
3.27% |
141.01 |
|
| £45-50K |
3.67% |
2.48% |
147.89 |
|
| £50-55K |
2.93% |
1.90% |
154.00 |
|
| £55-60K |
2.35% |
1.47% |
159.43 |
|
| £60-65K |
1.89% |
1.15% |
164.25 |
|
| £65-70K |
1.53% |
0.91% |
168.53 |
|
| £70-75K |
1.24% |
0.72% |
172.33 |
|
| £75-80K |
1.01% |
0.57% |
175.72 |
|
| £80-85K |
0.83% |
0.46% |
178.73 |
|
| £85-90K |
0.68% |
0.37% |
181.40 |
|
| £90-95K |
0.56% |
0.31% |
183.78 |
|
| £95-100K |
0.46% |
0.25% |
185.90 |
|
| £100K + |
2.59% |
1.34% |
192.97 |
|
|
|

|


|
1992-1997
|
1997-2001
|
|
|
|
| Con |
-14.18% |
| Lab |
17.86% |
| LD |
-3.82% |
|
| Con |
-7.90% |
| Lab |
2.00% |
| LD |
4.24% |
|
|
 |
Stephen Pound
Labour hold
|
| Con |
 |
13,185 |
29.33% |
| Lab |
 |
25,022 |
55.66% |
| LD |
 |
5,043 |
11.22% |
| Oth |
 |
1,707 |
3.80% |
| Maj |
 |
11,837 |
26.33% |
| Turn |
 |
44,957 |
57.99% |
|
|
 |
Stephen Pound
Labour hold
|
| LD |
Francesco Fruzza |
5,043 |
11.22% |
| UK |
Daniel Moss |
668 |
1.49% |
| L |
Stephen Pound |
25,022 |
55.66% |
| G |
Astra Seibe |
1,039 |
2.31% |
| C |
Charles Walker |
13,185 |
29.33% |
|
Candidates representing 5 parties stood for election to this seat.
|
|
 |
Stephen Pound
Labour gain
|
| Con |
 |
20,744 |
37.22% |
| Lab |
 |
29,904 |
53.66% |
| LD |
 |
3,887 |
6.98% |
| Ref |
|
0 |
0.00% |
| Oth |
 |
1,191 |
2.14% |
| Maj |
 |
7,170 |
12.87% |
| Turn |
 |
55,726 |
71.31% |
|
|
 |
|
Conservative
|
| Con |
 |
29,917 |
51.40% |
| Lab |
 |
20,842 |
35.80% |
| LD |
 |
6,266 |
10.80% |
| Oth |
 |
1,175 |
2.00% |
| Maj |
 |
9,075 |
15.60% |
| Turn |
 |
58,200 |
76.67% |
|
|
 |
|

|

